Revenue dashboard
تفاصيل العمل
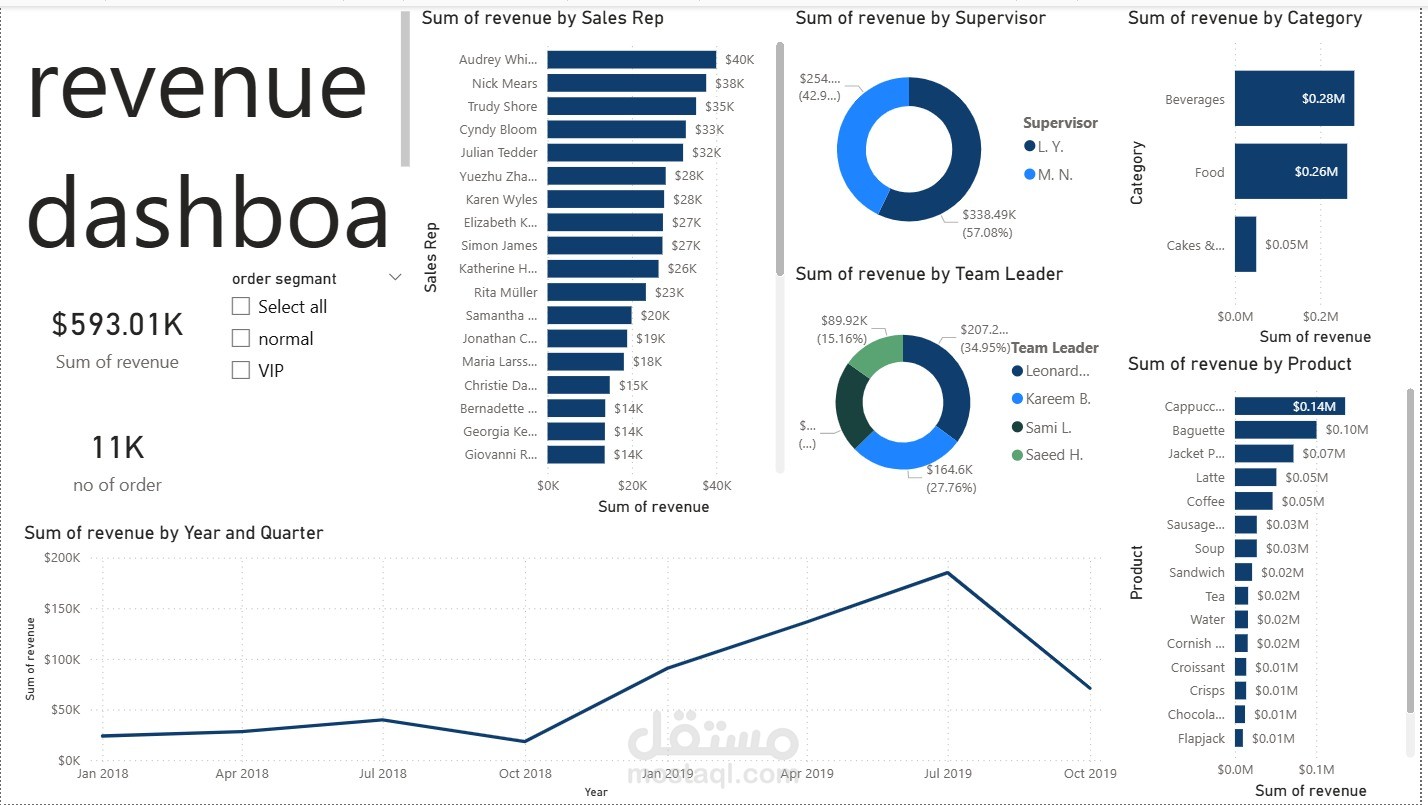
Sales & Revenue Analysis Dashboard – Power BI
Developed an interactive Power BI dashboard to analyze sales performance and revenue trends. The dashboard provides a comprehensive view of total revenue, number of orders, and sales distribution across sales representatives, supervisors, team leaders, product categories, and individual products.
It includes dynamic filters for order segments, allowing users to easily explore different customer groups. The dashboard also highlights revenue trends over time using a quarterly analysis, helping businesses identify growth patterns and performance fluctuations.
The goal of this project was to transform raw sales data into clear visual insights that support data-driven decision making and performance monitoring.