HR Analytics Dasshboard Excel / pivot tables&charts / KPI
تفاصيل العمل
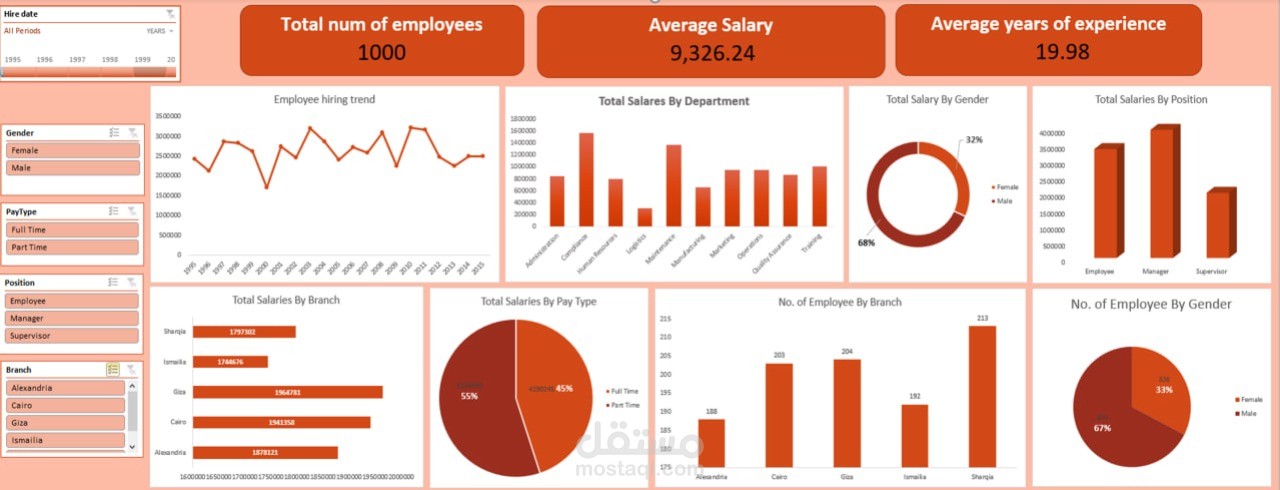
what did i do in this project ?
1. Built interactive dashboard using Pivot Tables and Pivot Charts.
2. Designed KPI cards to track Total Employees, Average Salary, and Average Years
of Experience.
3. Analyzed employee hiring trends across multiple years.
4. Evaluated salary distribution by department, position, branch, gender, and pay
type.
5.
6. Implemented dynamic slicers and timeline filters for flexible data exploration.