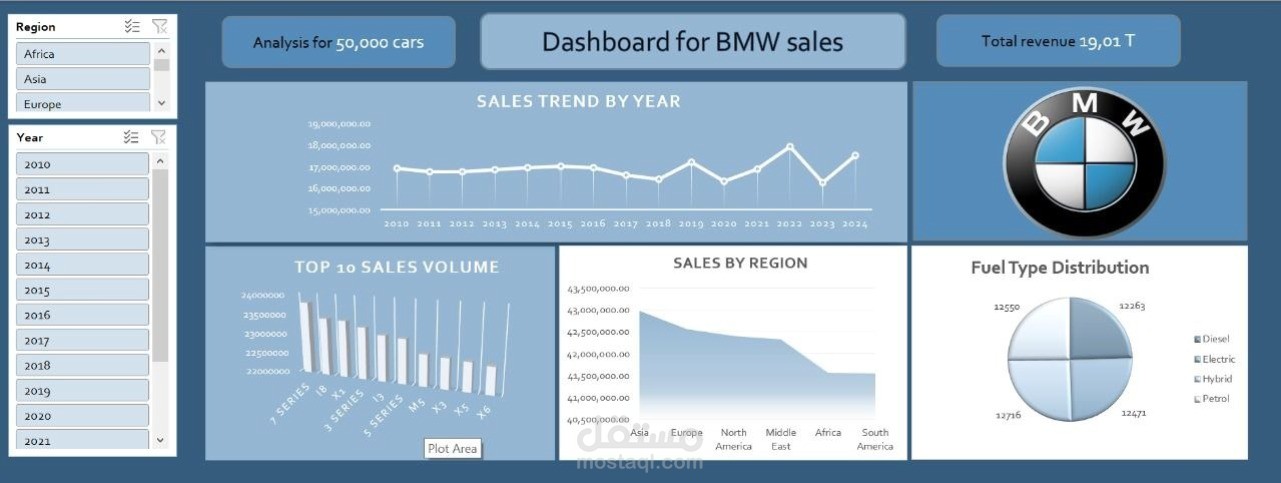
BMW sales analysis (50,000 cars) Excel / power query / DAX
تفاصيل العمل
what did i do in this project ?
1. Cleaned and transformed raw data using Power Query.
2. Created calculated measures using DAX.
3. Built an interactive dashboard with dynamic slicers.
4. Designed KPI cards.
5. Developed visualizations to analyze top models, regional sales,
fuel distribution, and sales trend.