Power BI Retail Revenue Dashboard | Data Cleaning & Sales Analysis
تفاصيل العمل
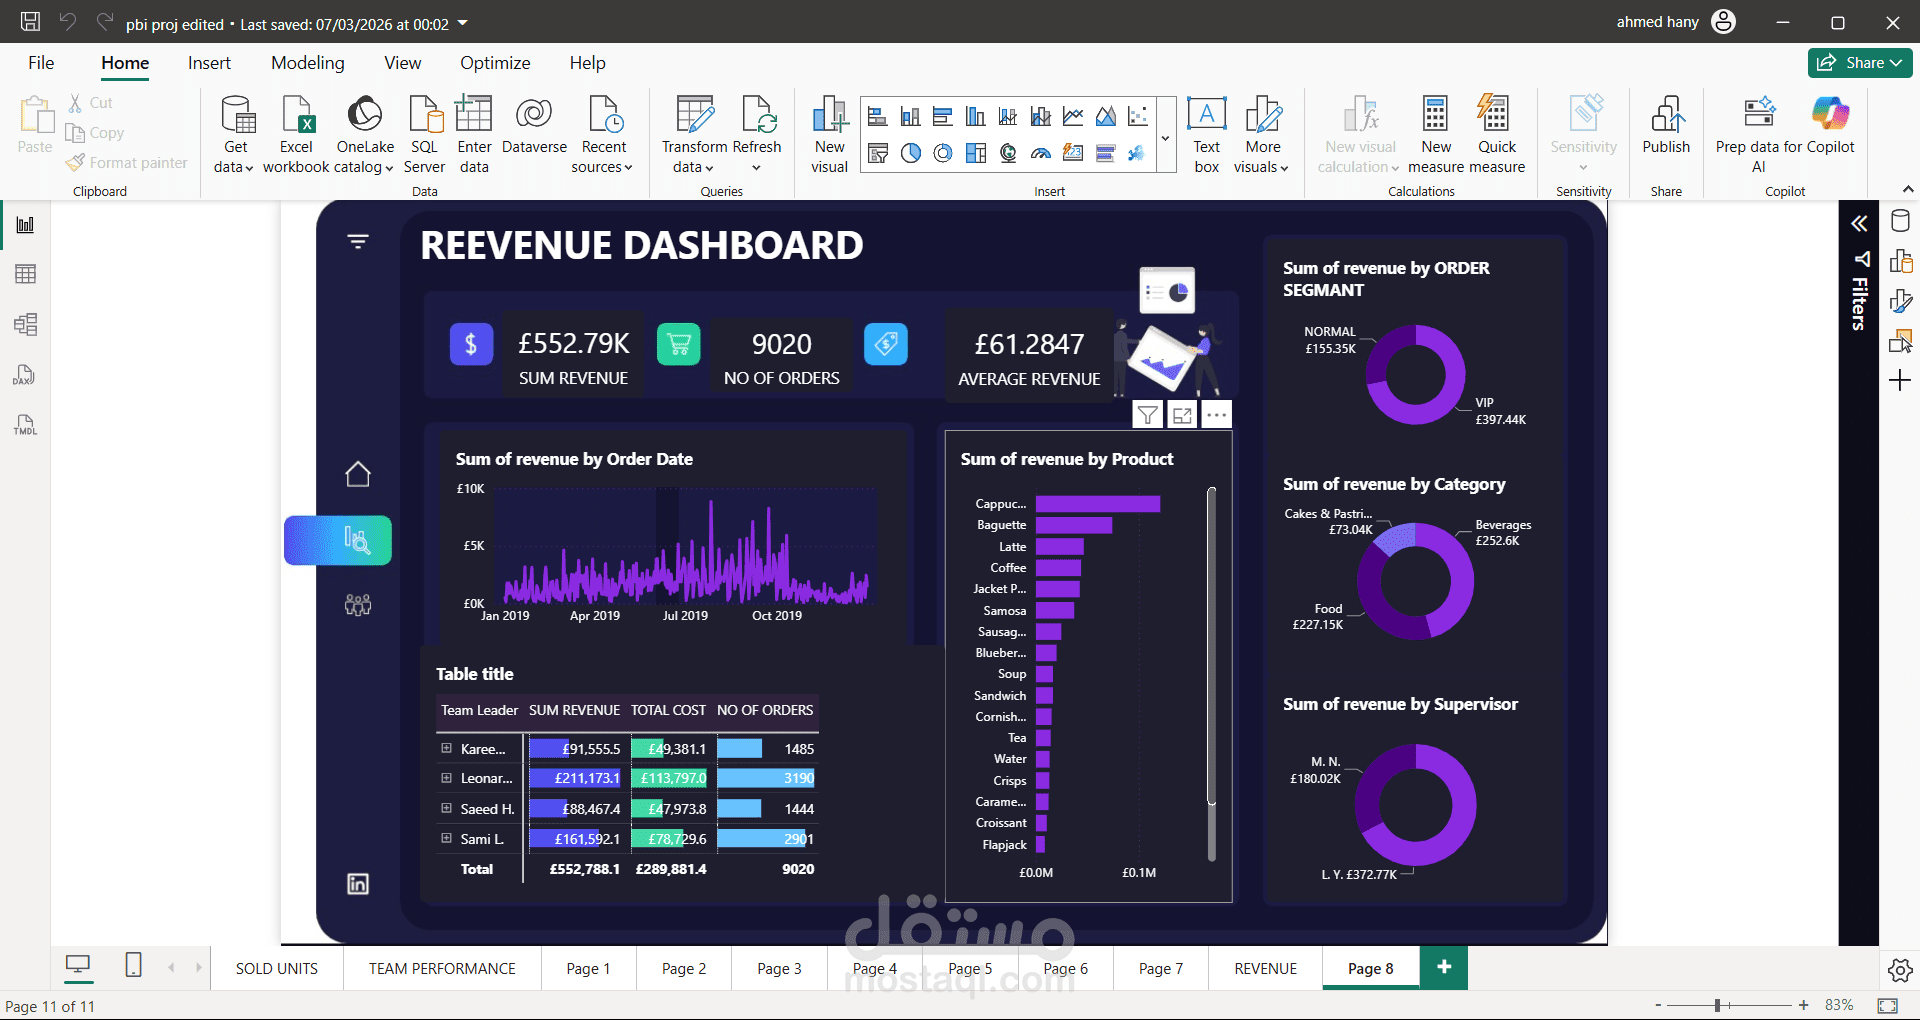
I developed an interactive Power BI dashboard to analyze retail sales performance. The project includes data cleaning using Power Query and the creation of clear visualizations to help management understand revenue trends.
Key features of the dashboard:
Data cleaning and transformation using Power Query
Revenue analysis by product category
Regional revenue distribution using a map
Revenue breakdown by payment method
Detailed table showing product sales performance
The dashboard provides a clear overview of sales performance and helps support better business decision-making.
Tools used:
Power BI
Power Query
Data Visualization