Olist
تفاصيل العمل
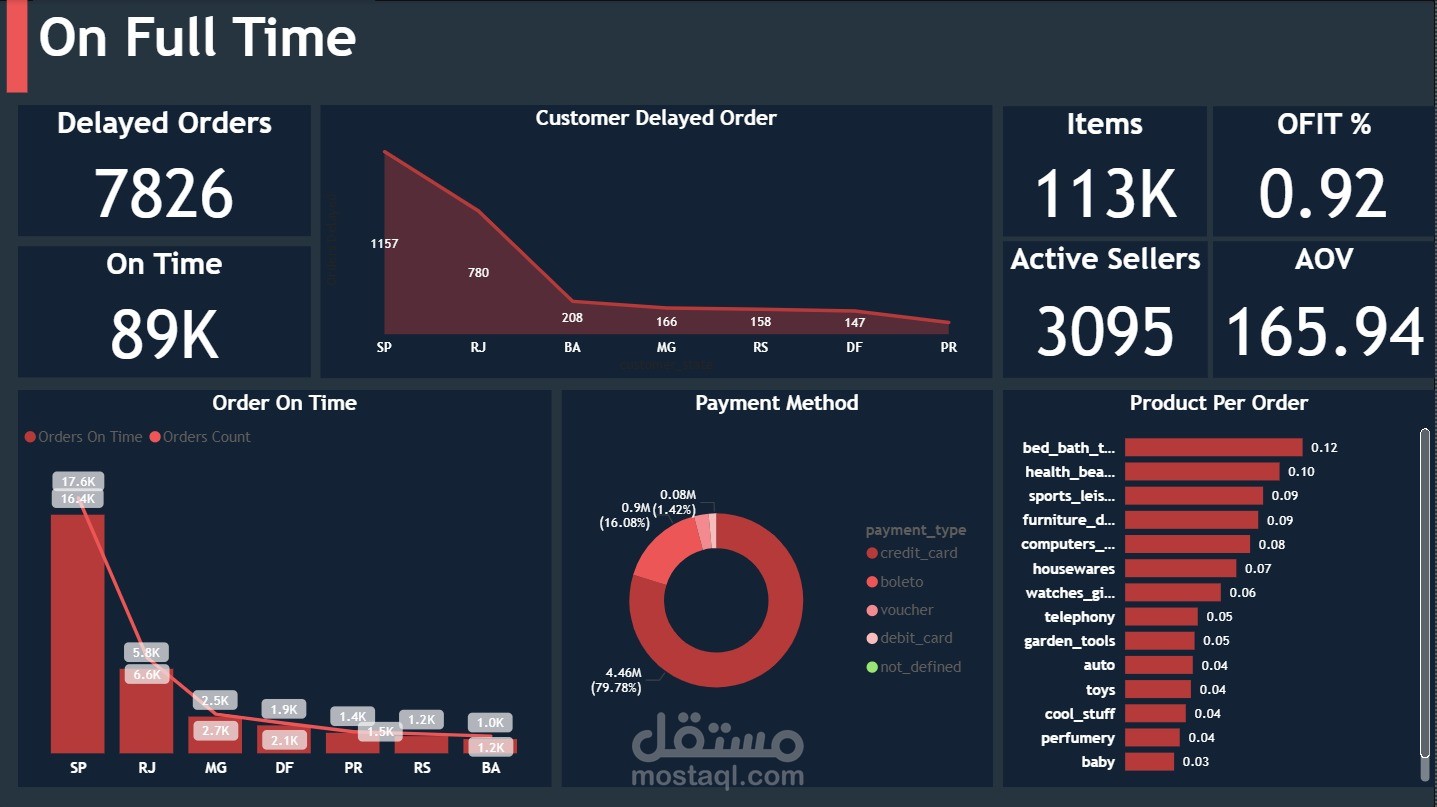
I turned 100K+ rows of raw E-commerce data into actionable business insights. ?
, I worked on a complete Data Analysis project using the famous Olist E-commerce Dataset.
Instead of just creating charts, I focused on answering real business questions.
Here are some insights I discovered ?
? Revenue Insights
• A small number of product categories generate the majority of revenue (Pareto principle).
• Certain cities dominate sales activity.
? Product Insights
• Some categories have high sales volume but low revenue.
• Others have low volume but very high prices.
? Payment Behavior
• Credit cards dominate payment methods.
• Installment payments are strongly associated with high order values.
⭐ Customer Satisfaction
• Delivery delays significantly impact customer reviews.
• Some product categories consistently receive lower ratings.
? Customer Geography
• Customers are heavily concentrated in specific Brazilian states.
• Geolocation data helped visualize customer density across regions.
? Tools I Used
• Python (Data Analysis)
• Pandas
• Seaborn
• SQL
• Power BI
? Project Workflow:
Data Cleaning → Data Integration → Exploratory Data Analysis → Visualization → Business Insights
This project strengthened my skills in:
✔ Data Cleaning
✔ Exploratory Data Analysis
✔ Business Insight Extraction
✔ Data Visualization
I'm excited to continue building data-driven solutions and turning data into real insights.