Exploratory Data Analysis on Roller Coaster Dataset Using Python
تفاصيل العمل

Created an Exploratory Data Analysis (EDA) project to analyze a roller coaster dataset and uncover patterns in coaster design and performance using Python data analysis and visualization tools.
The project includes:
Data cleaning and preprocessing
Handling missing values
Exploratory data analysis of coaster features
Creating multiple visualizations to identify trends and relationships
Key insights explored:
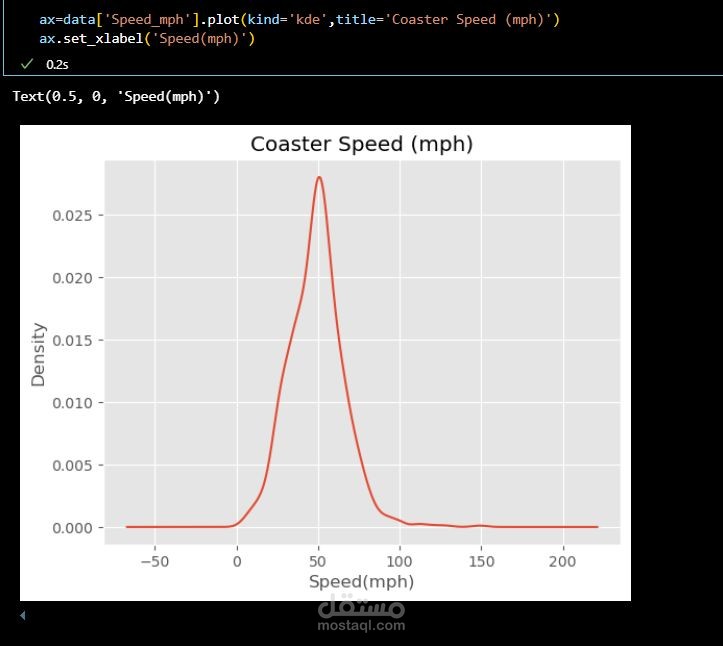
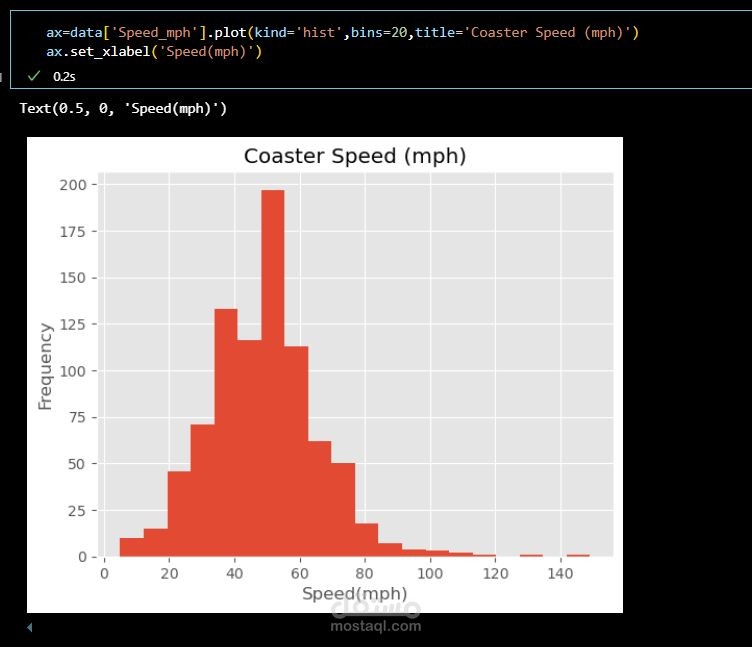
Distribution of roller coaster speeds
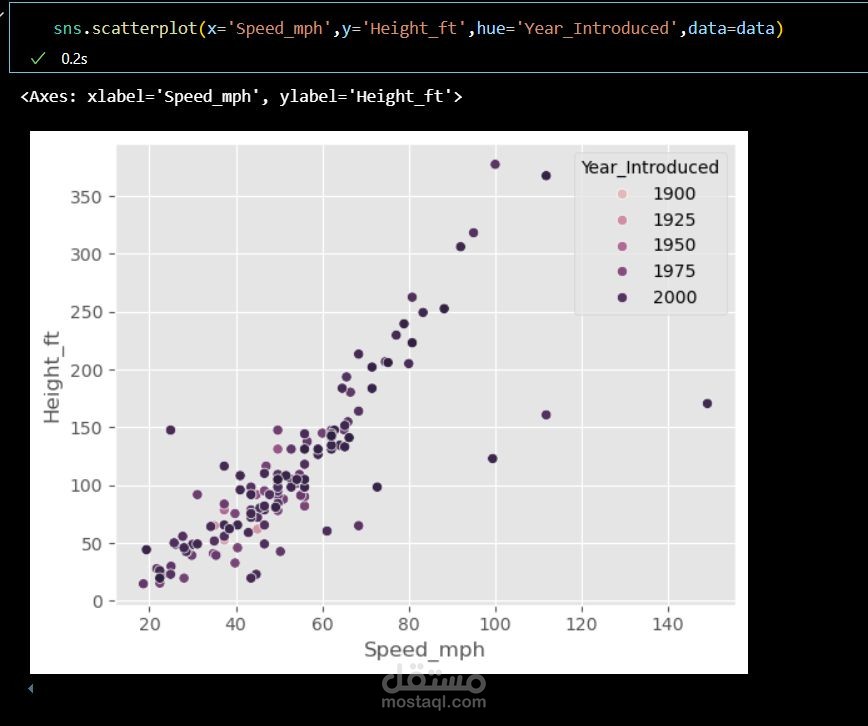
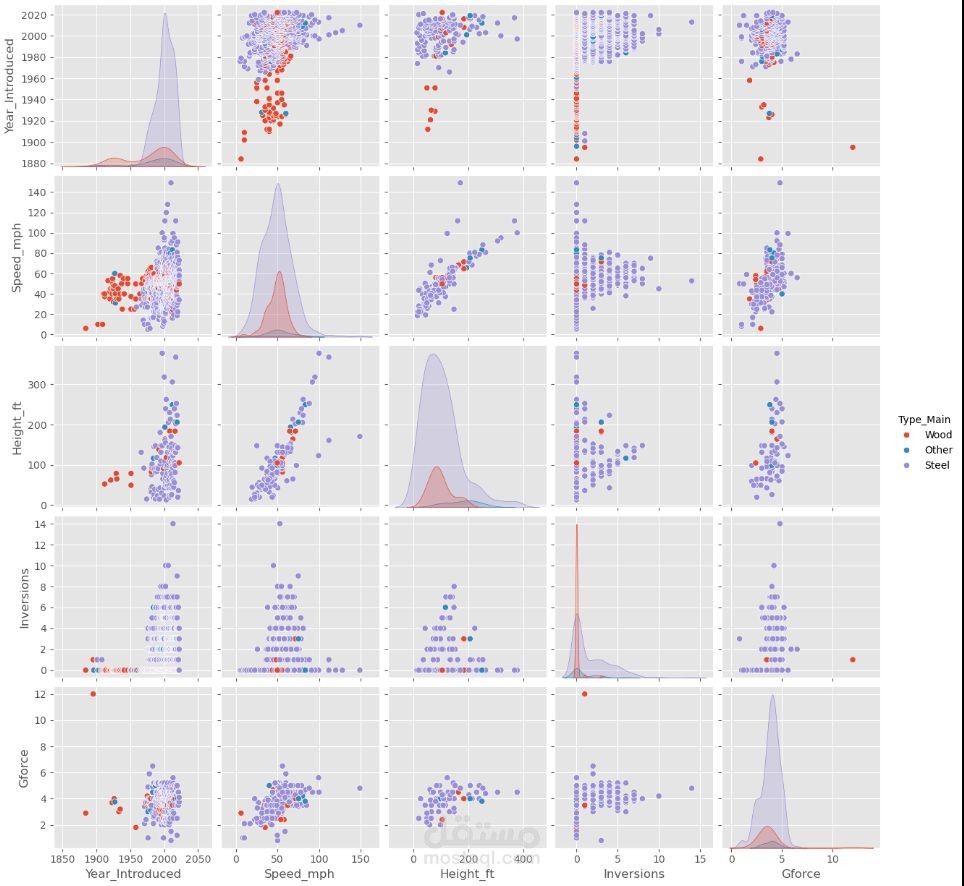
Relationship between speed and height
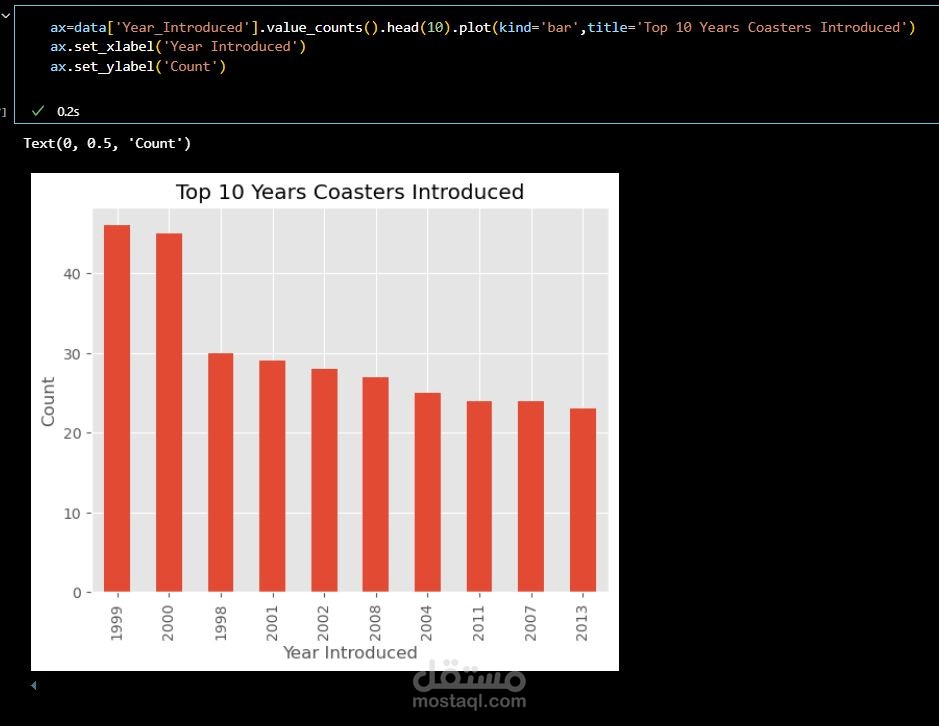
Top years when roller coasters were introduced
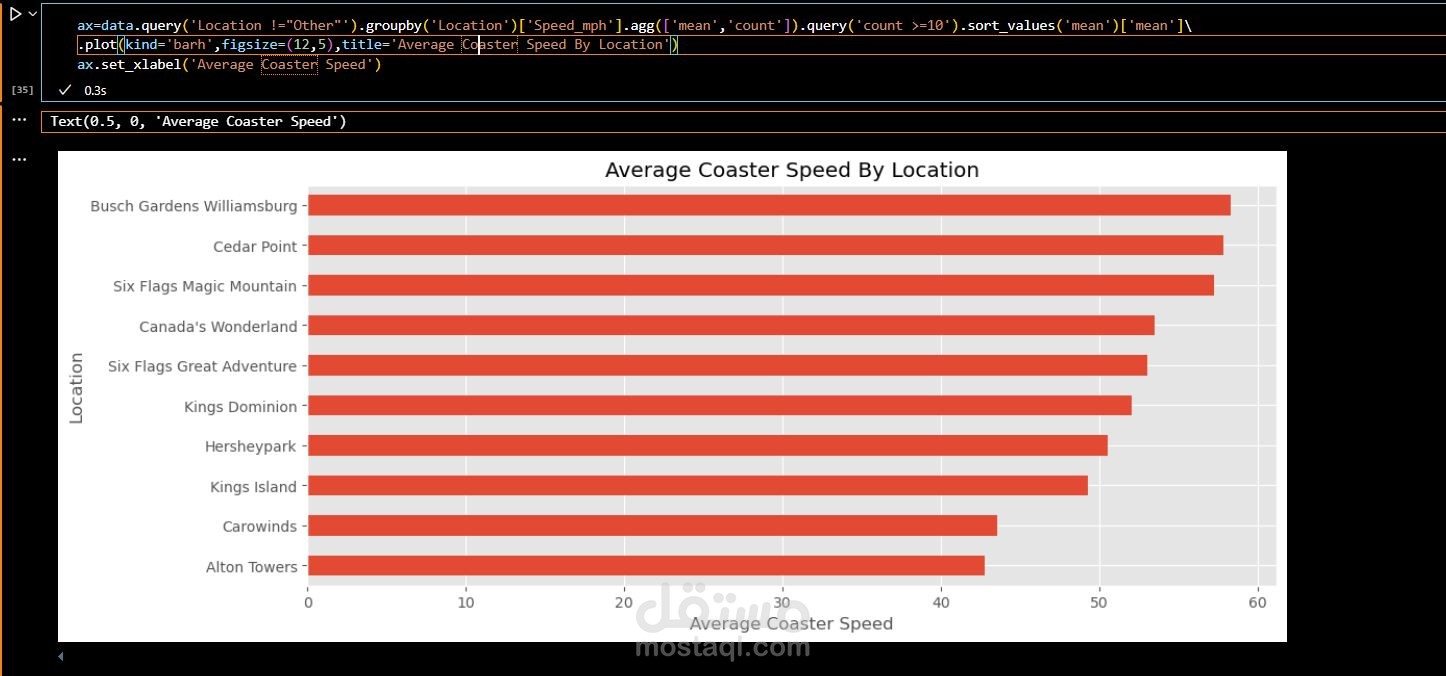
Average coaster speeds by location
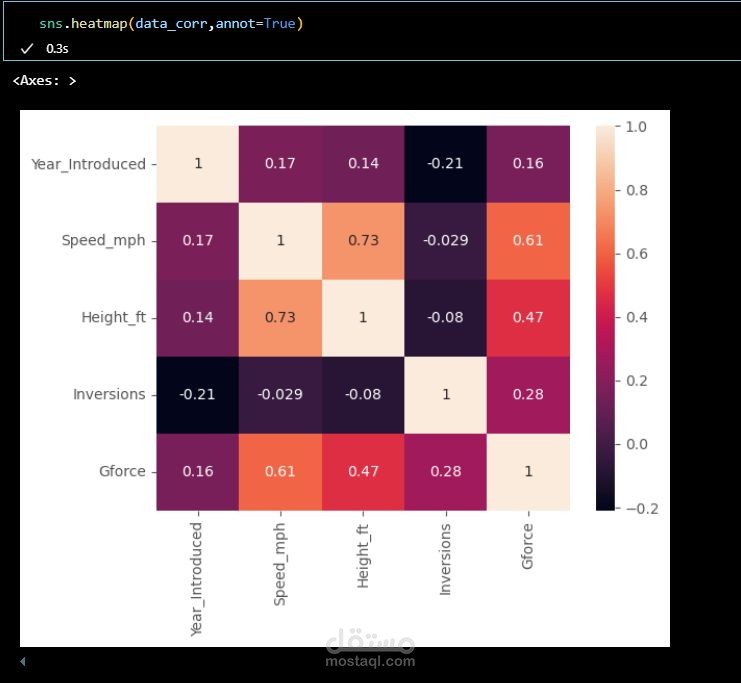
Correlation between features such as height, inversions, and g-force
Through visualizations such as scatter plots, histograms, KDE plots, and heatmaps, the project reveals interesting patterns in roller coaster development over time.
Tools used:
Python, Pandas, Matplotlib, Seaborn, Jupyter Notebook