Olympic Games Dashboard using Power BI
تفاصيل العمل
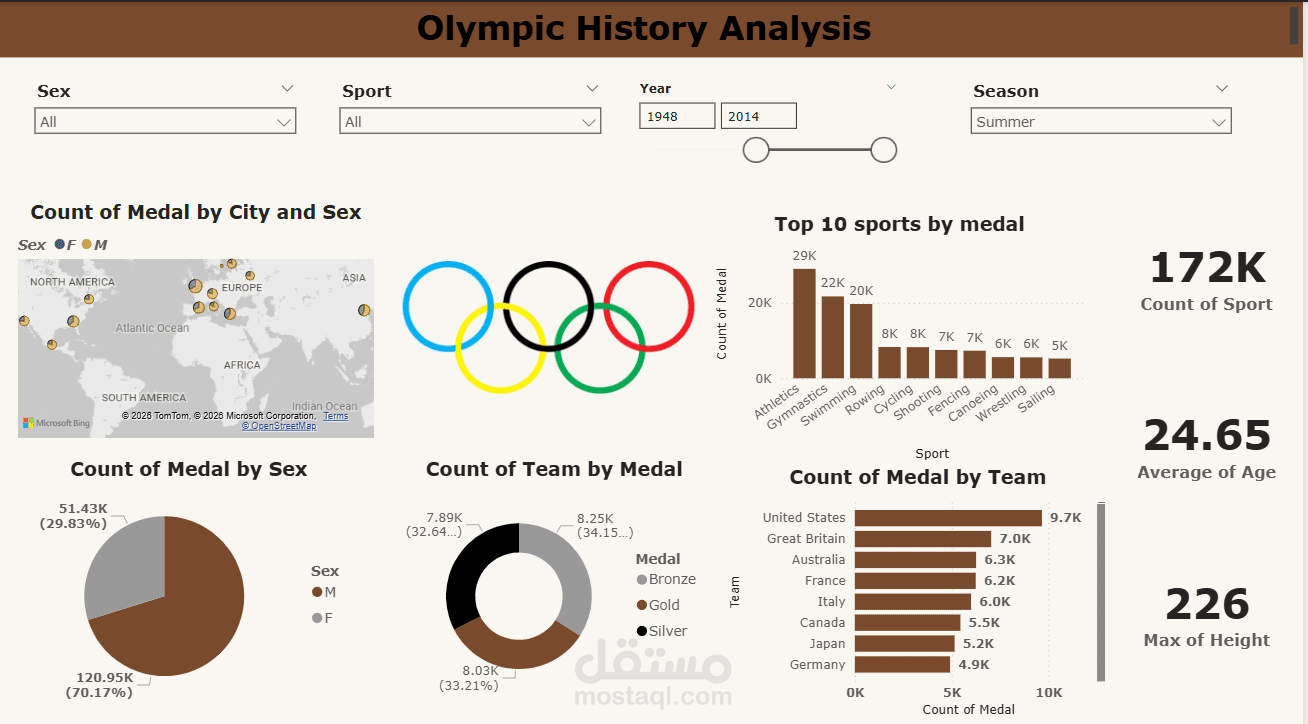

This project analyzes historical data from the Olympic Games to create an interactive dashboard using Microsoft Power BI. The goal of the project is to explore Olympic performance data and visualize key insights about athletes, countries, and medals over time.
The dashboard provides several analytical views, including:
Total number of athletes, sports, and participating countries
Distribution of gold, silver, and bronze medals
Top countries with the highest number of medals
Medal distribution by sport and event
Performance trends across different Olympic years
Gender participation analysis (male vs female athletes)
Using Power BI, the dataset was cleaned and transformed, and multiple visualizations were created such as bar charts, maps, KPI cards, and trend graphs. Interactive filters and slicers allow users to explore the data by year, country, sport, or athlete, making the dashboard dynamic and easy to analyze.