Amazon Prime Dashboard using Power BI
تفاصيل العمل

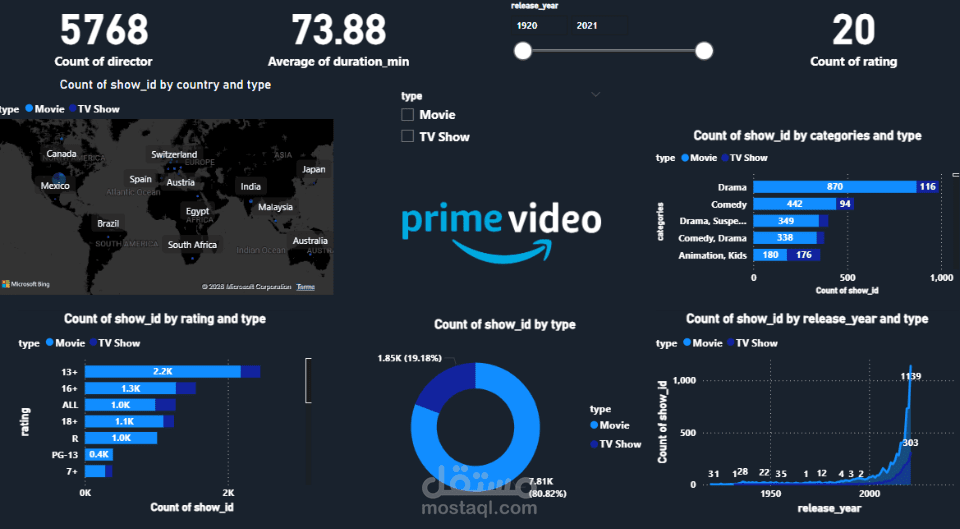
This project focuses on analyzing the Amazon Prime dataset and building an interactive dashboard using Microsoft Power BI. The goal of the dashboard is to explore and visualize the content available on the **Amazon streaming platform Amazon Prime, including movies and TV shows.
The dashboard provides insights into several aspects of the platform such as:
Total number of movies and TV shows
Distribution of content by genre
Number of titles released per year
Content distribution by country
Ratings classification (PG, R, etc.)
Top contributing directors and actors
Using Microsoft Power BI, the data was cleaned, transformed, and visualized through different charts such as bar charts, pie charts, maps, and KPI cards. The dashboard allows users to interact with the data through filters and slicers to explore trends and patterns in Amazon Prime’s content library.
The main objective of this project is to demonstrate data analysis and data visualization skills, and how dashboards can help stakeholders quickly understand large datasets and make data-driven decisions.