Zomato_Dashboard
تفاصيل العمل

Tools: Power BI (DAX, Power Query), Excel | Timeline: 2 weeks
Problem: Food delivery platform lacked a centralized dashboard to monitor sales performance, user behavior, and city-level order trends.
• Analyzed food delivery transaction data to identify patterns in orders, sales value, user activity, and ratings across different cities and food categories.
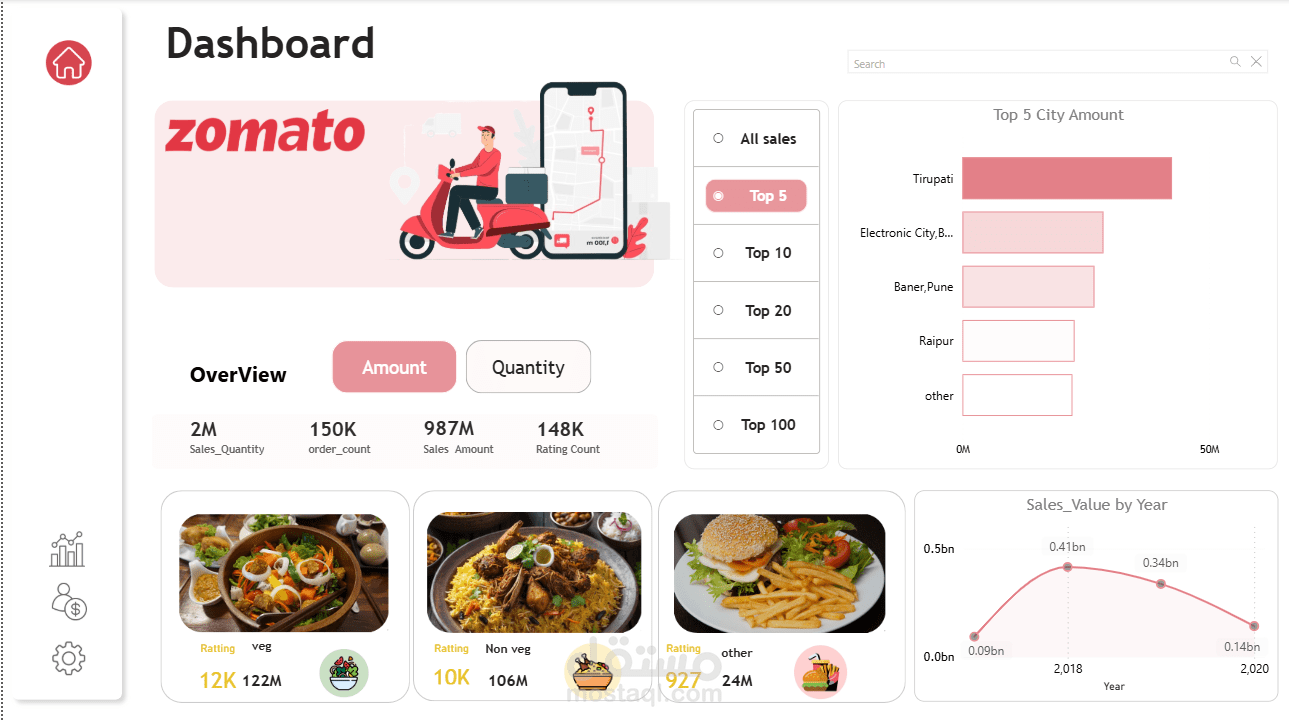
• Built an interactive Power BI dashboard to monitor key metrics including total sales amount (987M), order count (150K), sales quantity (2M), and rating counts.
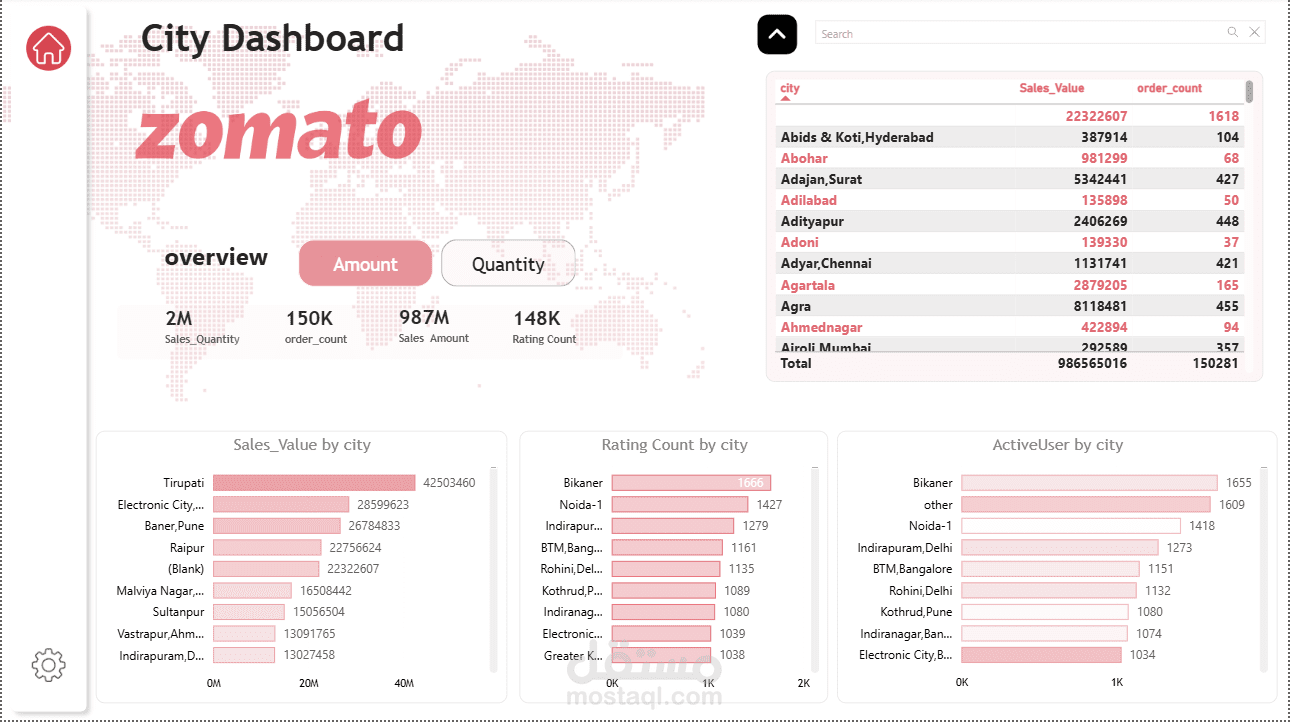
• Developed dynamic visualizations to analyze sales performance by city, yearly sales trends, and category performance (Veg, Non-Veg, Other).
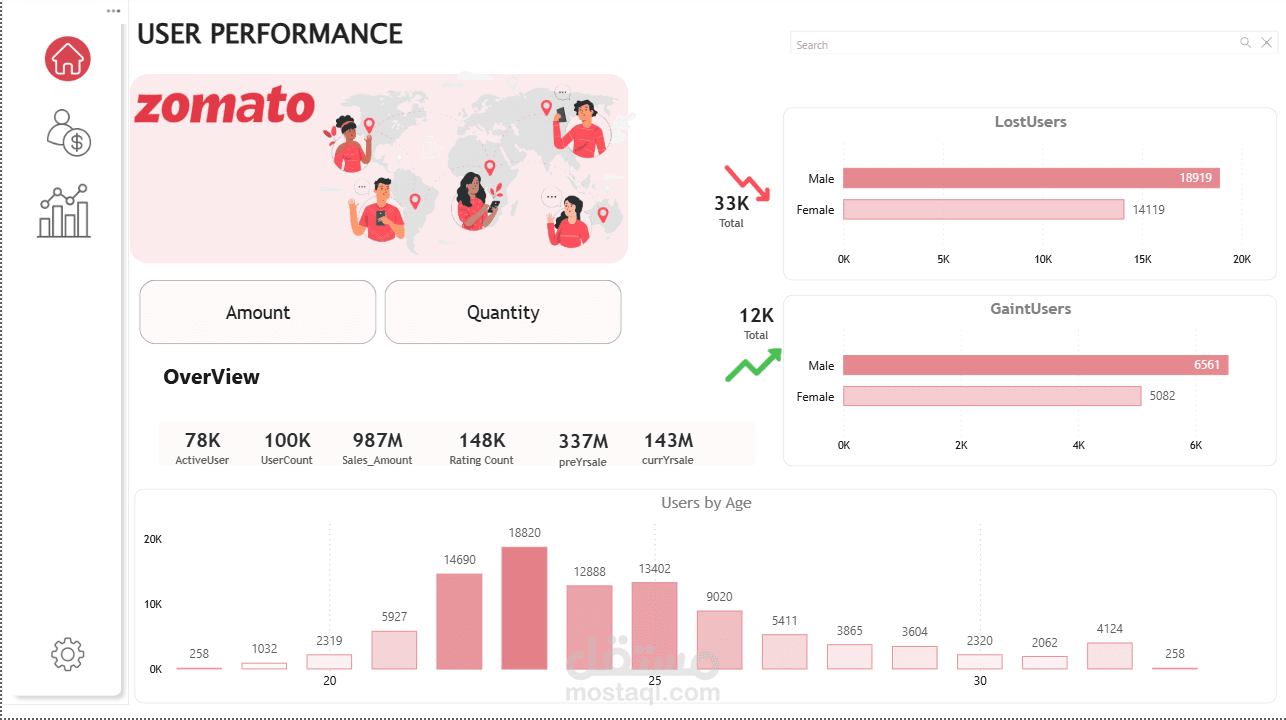
• Created multiple DAX measures such as total sales value, order count, active users, lost users, gained users, and rating counts.
• Designed visualizations including KPI cards, bar charts, line charts, and tables to highlight city performance, user demographics, and sales trends.
• Built separate analytical views for User Performance and City Performance to explore user growth, lost users, gained users, and active users by location.
• Implemented interactive filters and slicers allowing dynamic analysis by Top cities, sales metrics (amount/quantity), and time trends.
• Reduced manual reporting by delivering a real-time business intelligence dashboard enabling faster insights into sales growth, customer behavior, and geographic performance.