Hospital_Dashboard
تفاصيل العمل
Tools: Power BI (DAX, Power Query), Excel | Timeline: 1 weeks
Problem: Hospital management lacked a centralized system to monitor patient information, medicine usage, and hospital charges in one place.
• Analyzed hospital patient records to identify trends in admissions, diagnoses, and medicine usage.
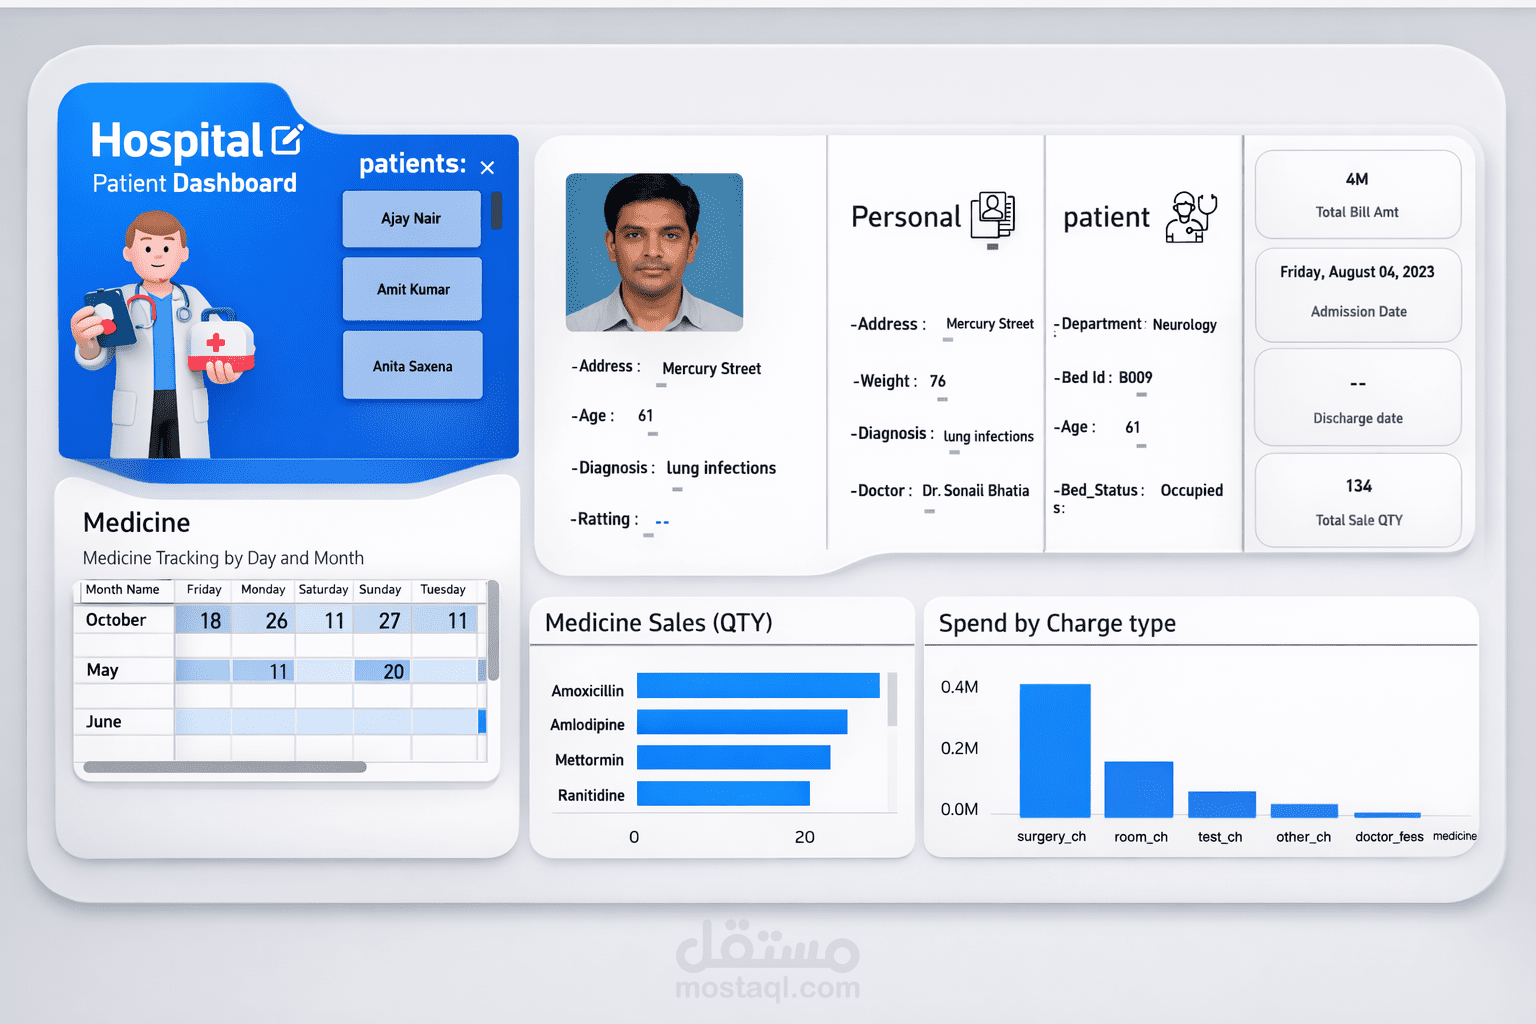
• Built an interactive Power BI dashboard displaying patient details, department information, billing metrics, and medicine sales.
• Developed dynamic visuals to track medicine sales quantity, patient information, and hospital charge distribution.
• Created multiple DAX measures including total bill amount, total medicine sales, and key hospital performance indicators.
• Designed visualizations such as KPI cards, bar charts, and tables to highlight medicine performance and spending by charge type.
• Enabled patient-level filtering to quickly view detailed patient information including doctor, department, diagnosis, and bed status.
• Reduced manual reporting by delivering an interactive monitoring tool that supports faster healthcare data insights and decision-making.