amazon_sales_dataset
تفاصيل العمل

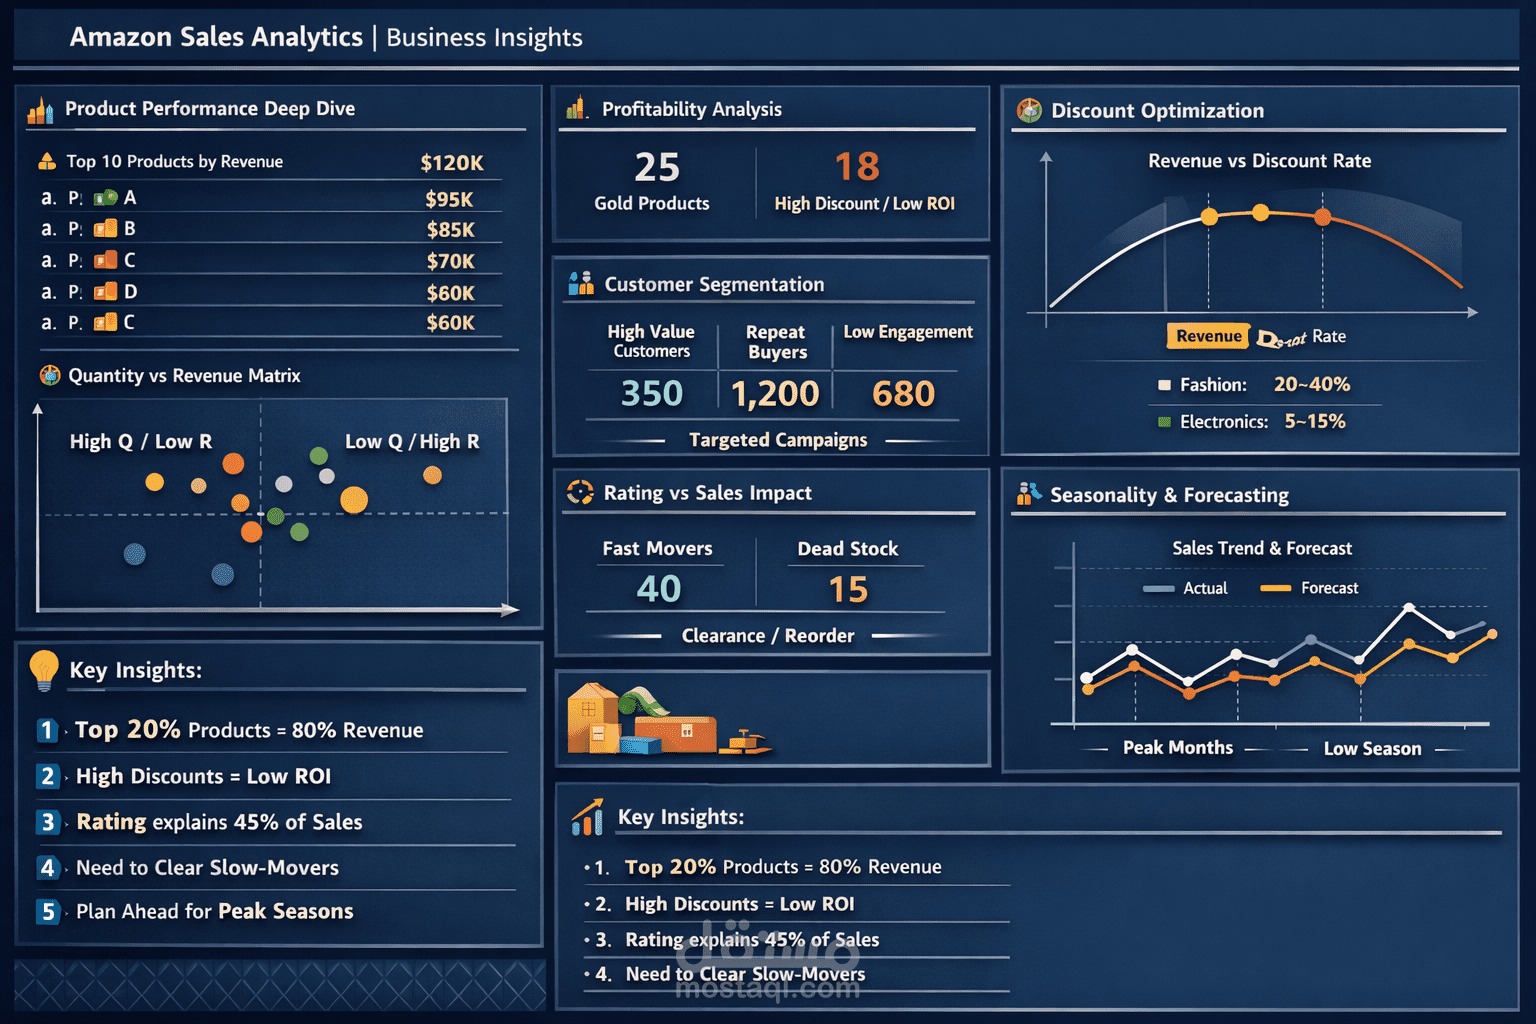
Amazon Sales Analytics Dashboard – Business Insights
This project presents an interactive Amazon Sales Analytics Dashboard designed to transform raw sales data into actionable business insights. The dashboard focuses on analyzing product performance, profitability, customer behavior, and seasonal sales trends to support data-driven decision making.
The analysis begins with a Product Performance Deep Dive, highlighting the Top 10 products by revenue and visualizing the relationship between sales quantity and revenue. This helps identify products that generate high revenue with low sales volume and those that sell in large quantities but generate relatively lower revenue.
A Profitability Analysis section categorizes products based on their return on investment, identifying “Gold Products” that perform well financially and high-discount products with low ROI, which may require pricing strategy adjustments.
The dashboard also includes Customer Segmentation, where customers are grouped into categories such as High-Value Customers, Repeat Buyers, and Low Engagement Customers. This segmentation helps businesses design targeted marketing campaigns and improve customer retention strategies.
Another important component is Discount Optimization, which examines the relationship between discount rates and revenue across different product categories. The insights reveal optimal discount ranges that maximize revenue without significantly reducing profitability.
The Rating vs. Sales Impact analysis investigates how product ratings influence sales performance. The results identify fast-moving products with strong demand and dead stock items that may require clearance or inventory management actions.
Finally, the dashboard provides a Seasonality and Forecasting section that visualizes sales trends over time and includes a simple forecast to anticipate peak sales months and low-demand periods, helping businesses plan inventory and marketing efforts more effectively.
Overall, the key insights derived from this analysis include:
A small percentage of products generate the majority of revenue (Pareto Principle).
High discounts often lead to lower profitability.
Product ratings significantly influence sales performance.
Slow-moving products require inventory clearance strategies.
Businesses should plan inventory and marketing around peak seasons.
This project demonstrates how data analytics and visualization can uncover patterns, optimize pricing strategies, improve customer targeting, and support strategic business decisions.