Ford GoBike Performance Dashboard
تفاصيل العمل
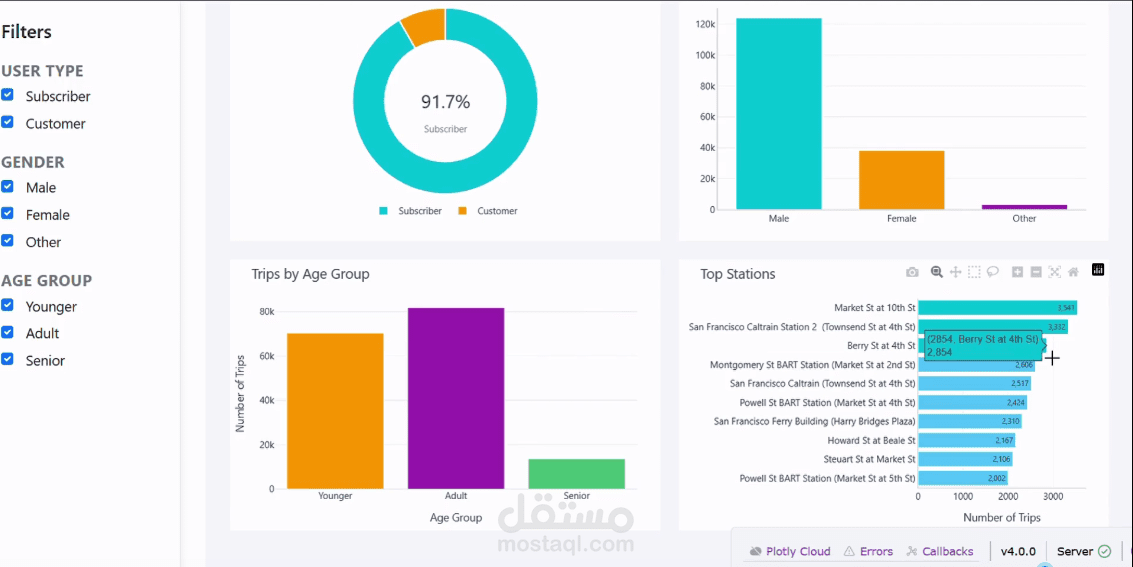
Developed an interactive data analysis dashboard to explore and analyze the Ford GoBike dataset. The project focused on transforming raw trip data into meaningful insights through data cleaning, preprocessing, exploratory data analysis (EDA), and visualization. Using Python and data analysis libraries, we analyzed user behavior, trip duration patterns, peak usage hours, and station demand. The final result was an interactive dashboard that allows dynamic filtering and clear visualization of key performance metrics.