Student Grades Analysis using Python
تفاصيل العمل
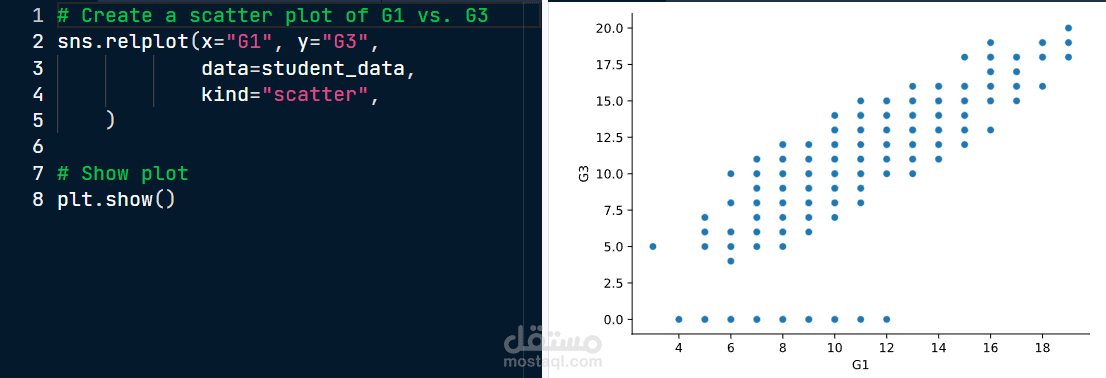
In this project, I created a scatter plot to analyze the relationship between students' first period grades (G1) and final grades (G3).
Using Python with Pandas, Seaborn, and Matplotlib, I visualized the data to identify patterns and correlations between the variables.
The scatter plot clearly shows how students' earlier grades relate to their final performance, helping to understand academic trends and performance patterns.
Tools used: Python, Pandas, Seaborn, Matplotlib.