Stock Market & Portfolio Analytics Dashboard
تفاصيل العمل
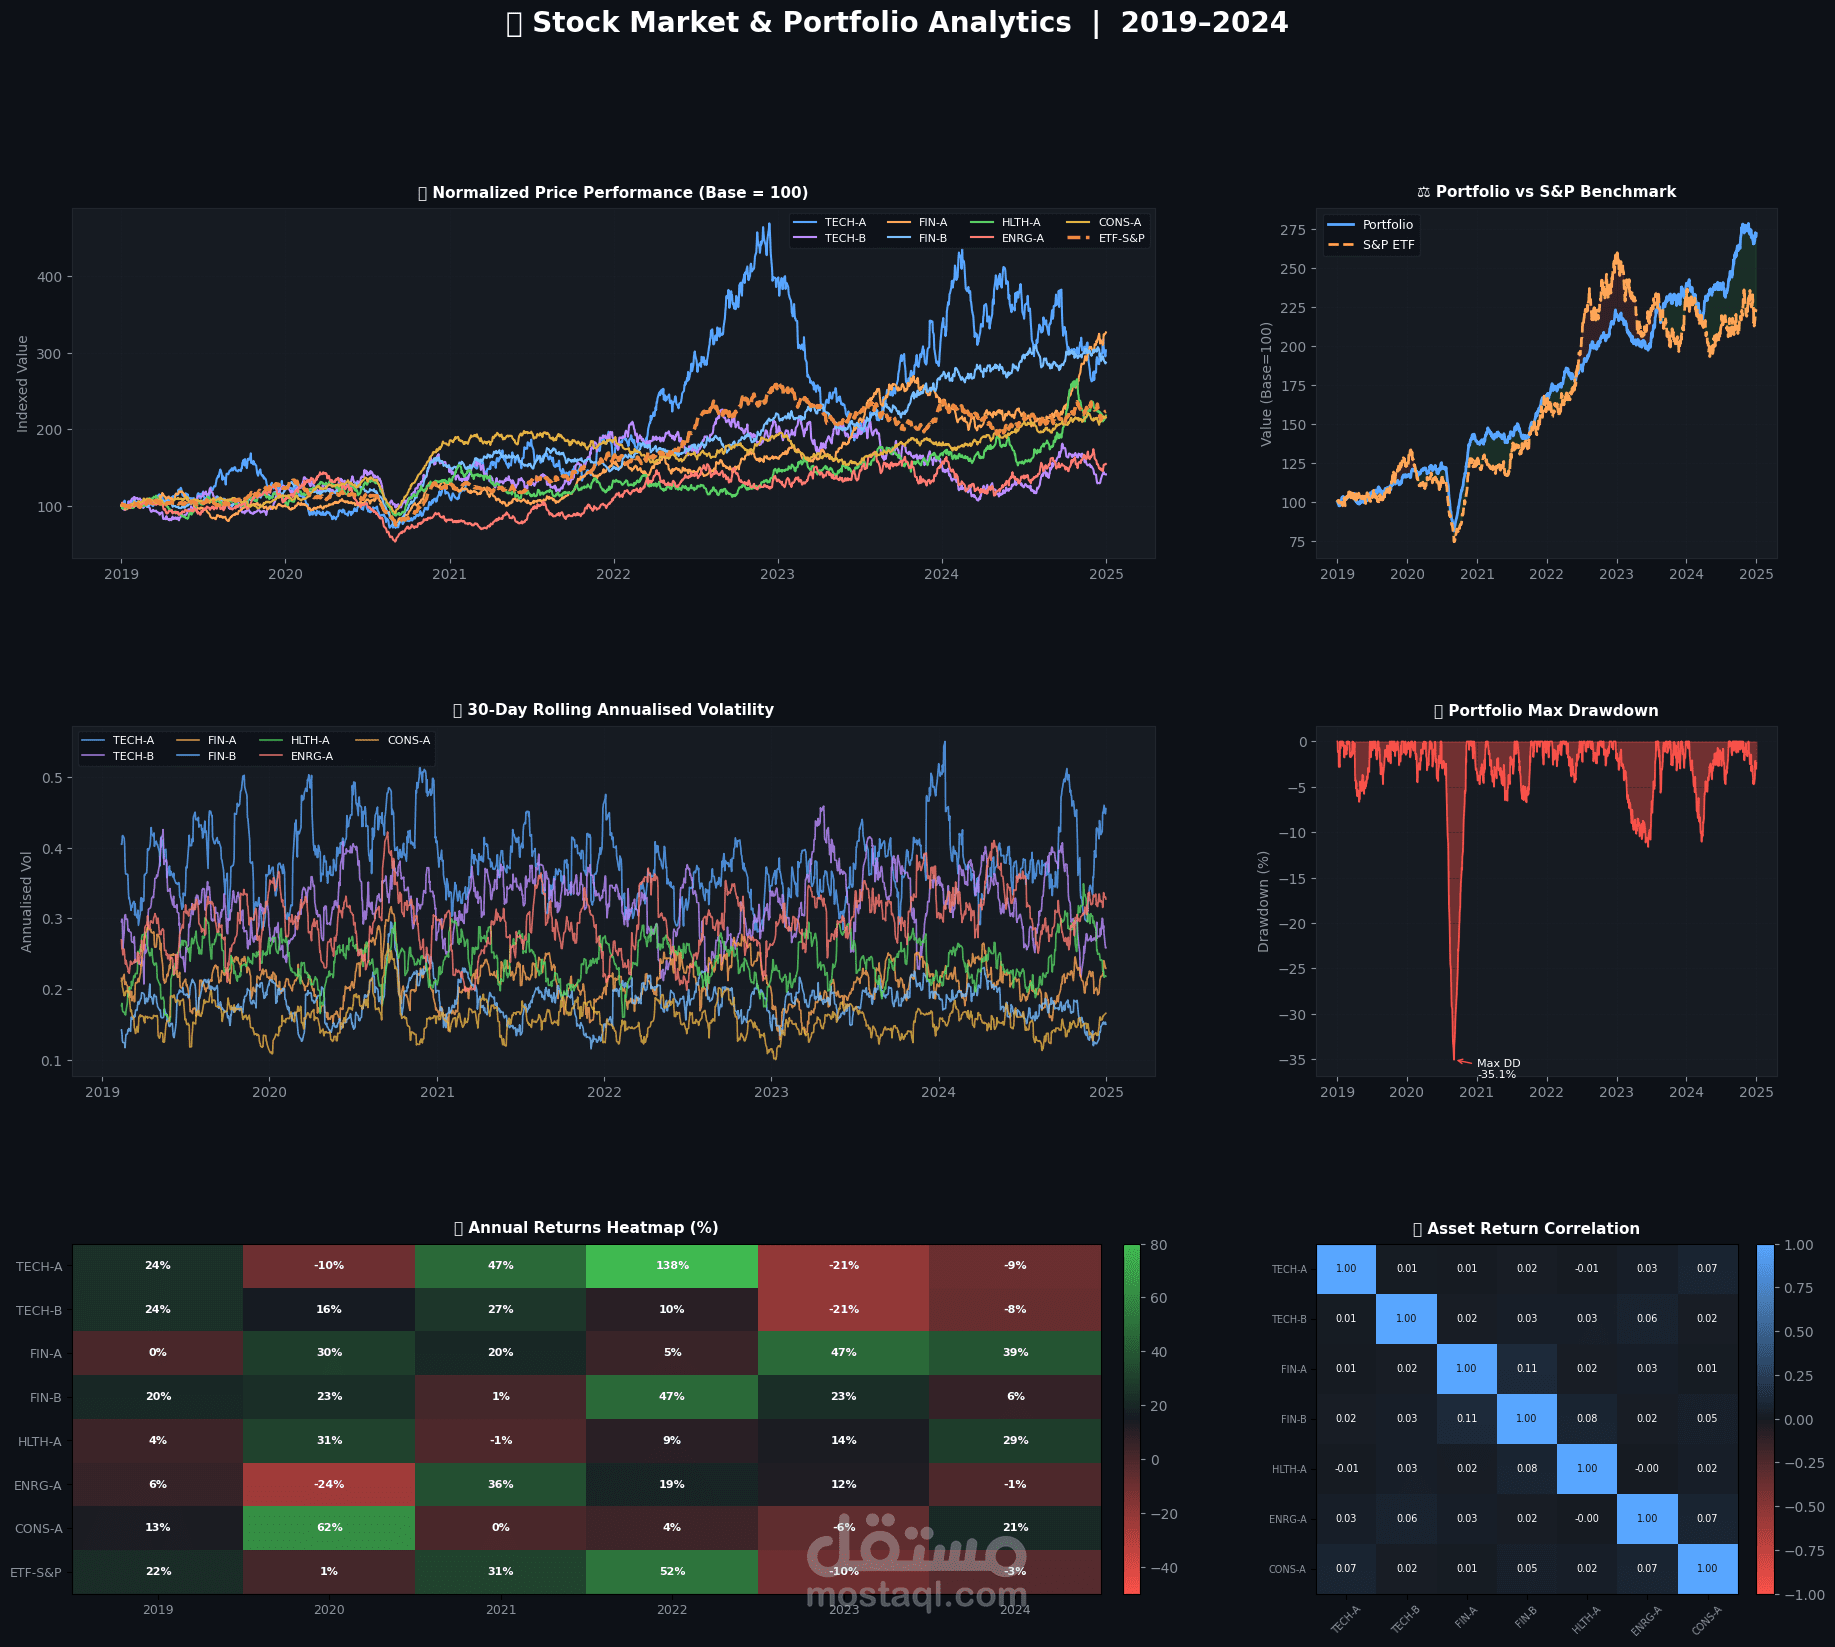
multi-asset portfolio analysis with technical indicators (2019–2024)
This notebook covers:
Candlestick-style OHLC price history
Rolling volatility (30-day) per asset
Sector performance heatmap
Portfolio allocation & returns
Drawdown analysis
Correlation between assets