Data Analysis & Visualization Using Python
تفاصيل العمل

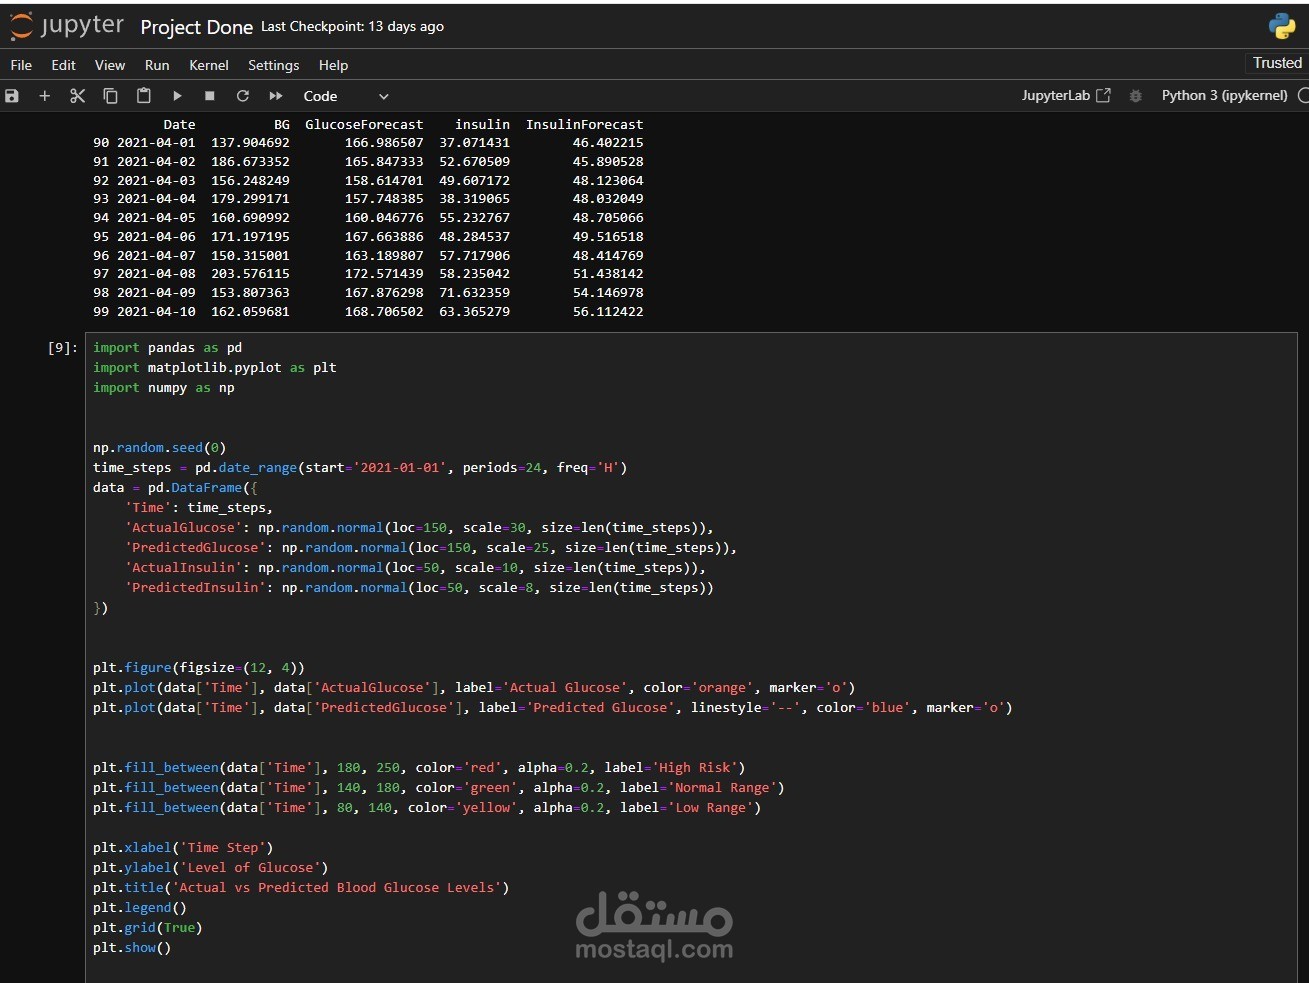
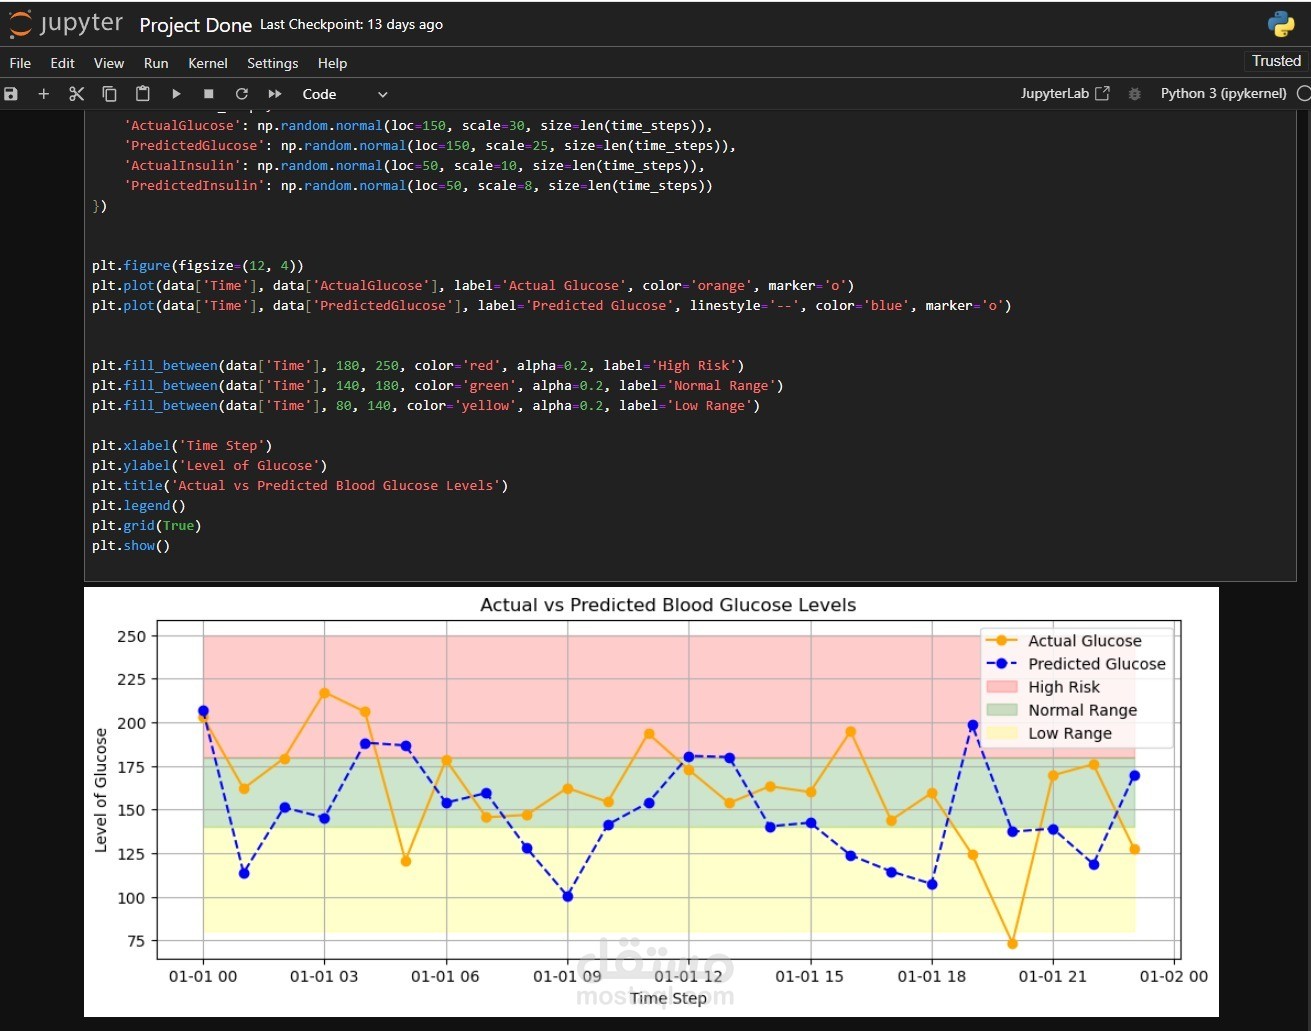
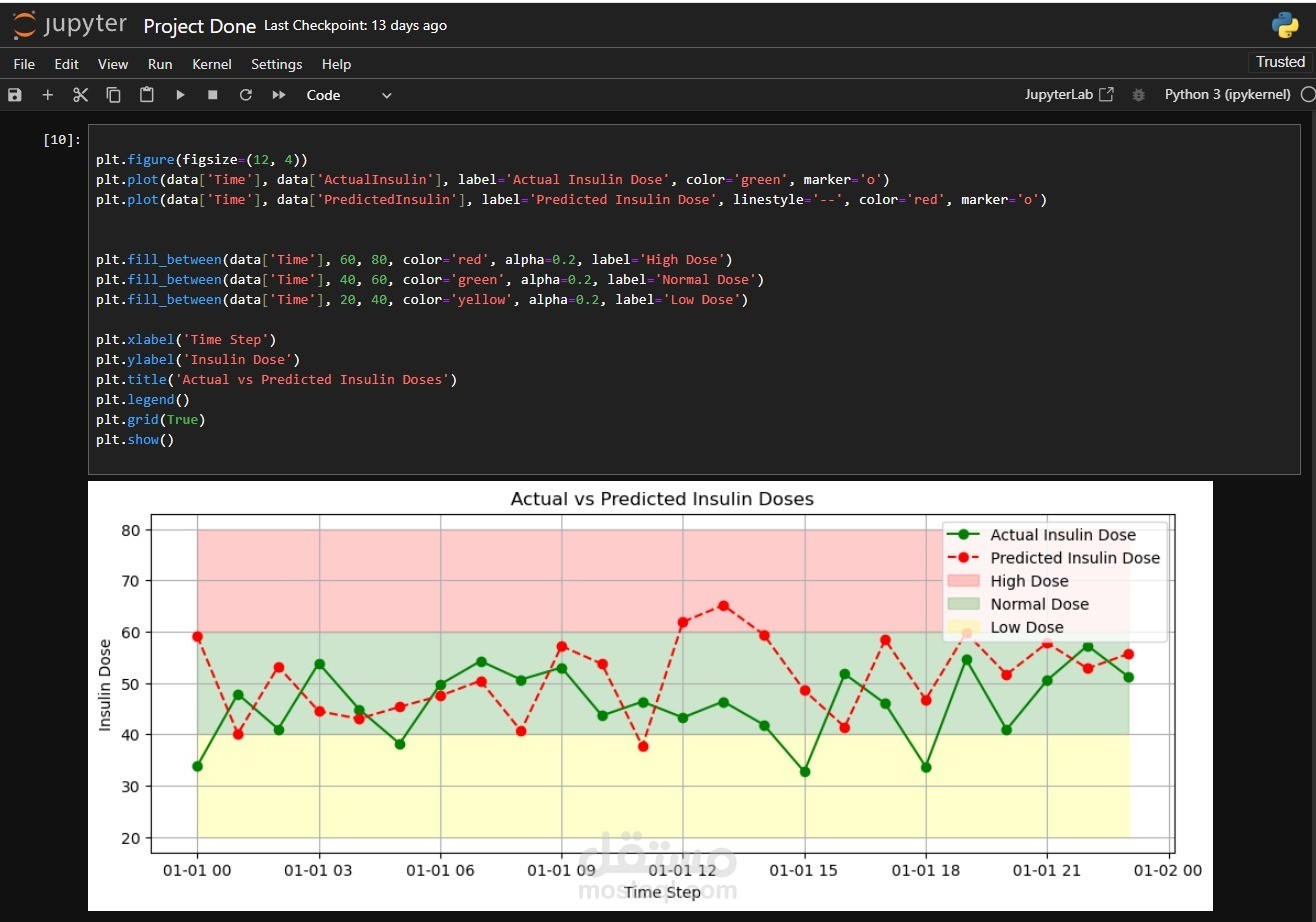
This project focuses on diabetes management analysis using Python. It employs libraries such as numpy, pandas, and matplotlib to predict blood glucose levels and insulin doses. The goal is to compare actual and predicted values to evaluate model performance. Visualizations include line charts for glucose and insulin levels, with shaded regions indicating high risk, normal range, and low range. These visual tools help identify discrepancies and assess the accuracy of the prediction model, providing critical insights for diabetes patients.