تحليل بيانات شركة Sallah Call Center بستخدام Power Bi
تفاصيل العمل
Two million calls. Three projects. Dozens of agents. All on one dashboard—built from scratch.
The work started with raw data. In Power BI, I appended three tables—February, March, and April—into a single table. To control the timing, I created a separate Calendar Table and linked it to the main table with a one-to-many relationship—this ensures that every date filter works accurately across the entire dashboard.
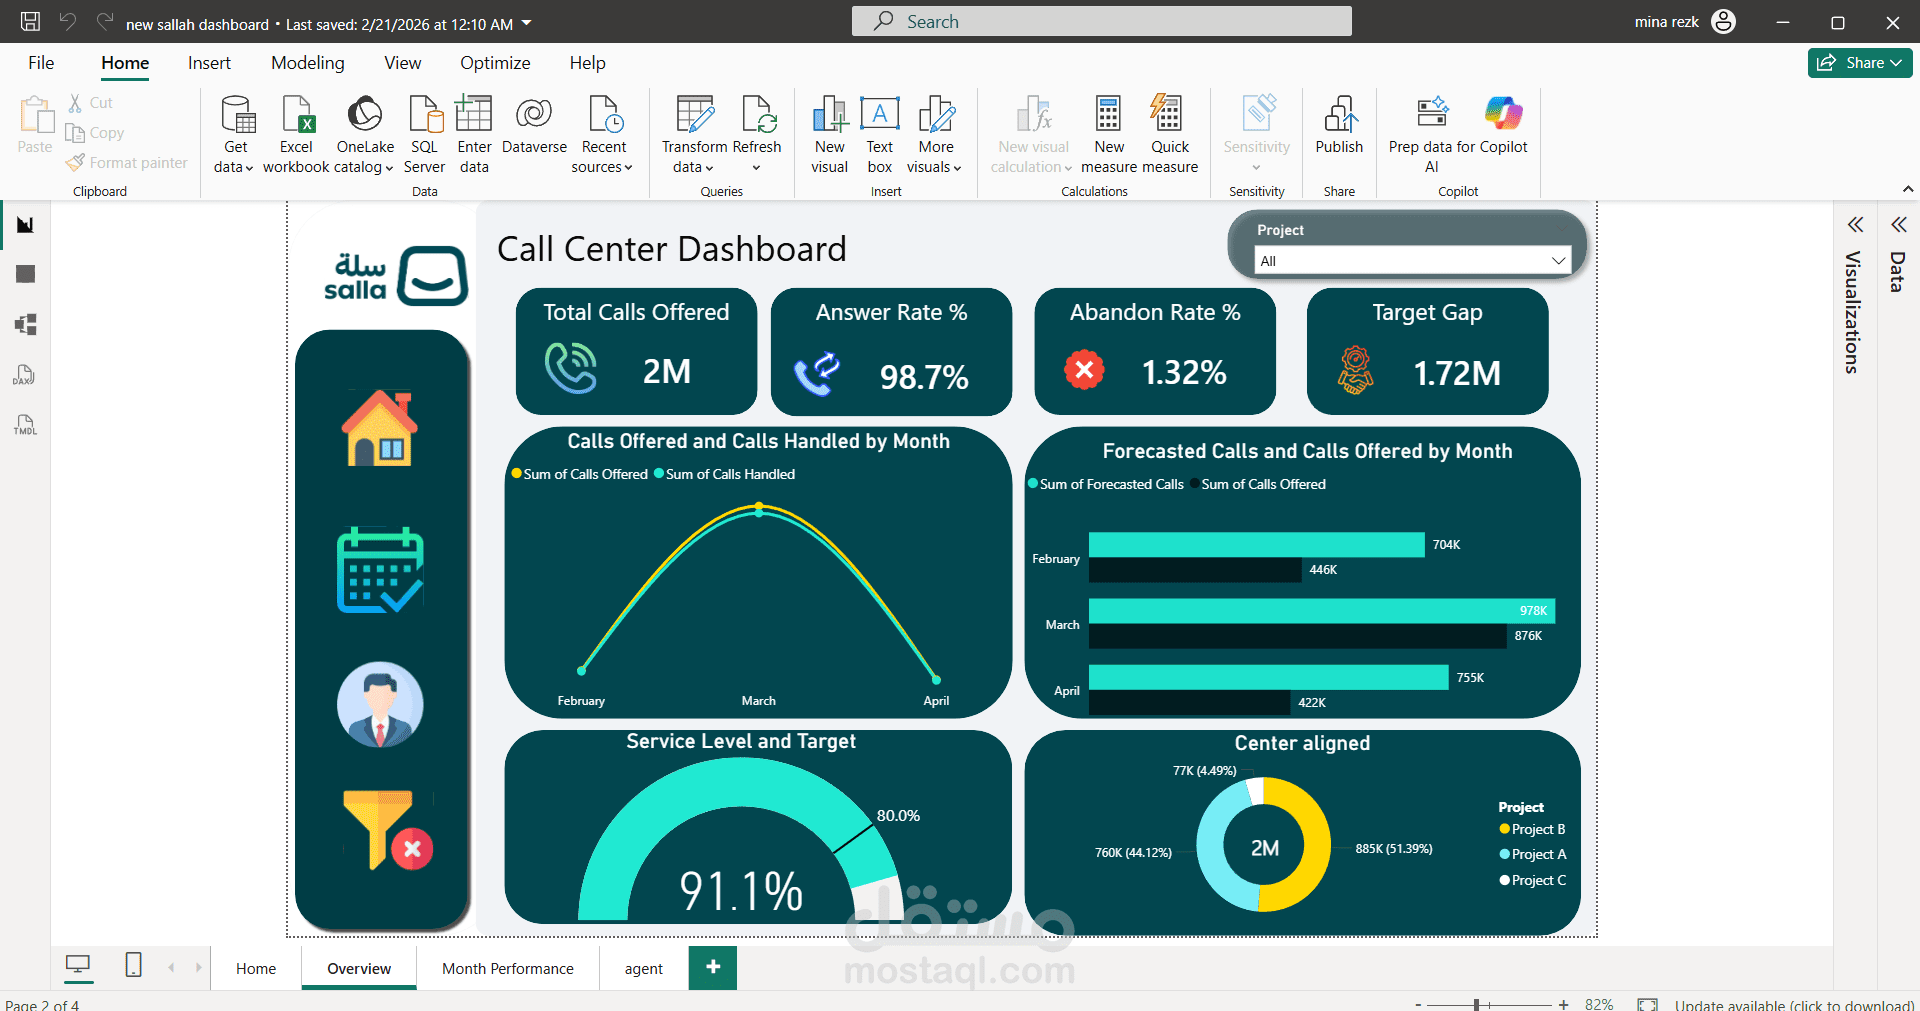
The first page is the Overview Page—an instant overview of the call center. In seconds, you see: a total of 2 million calls made, a 98.7% Answer Rate, and a 1.32% Abandon Rate. It also includes a Target Gap, which calculates the difference between performance and the actual target. This page has a project filter—you select Project A, B, or C—and the entire dashboard updates in real time.
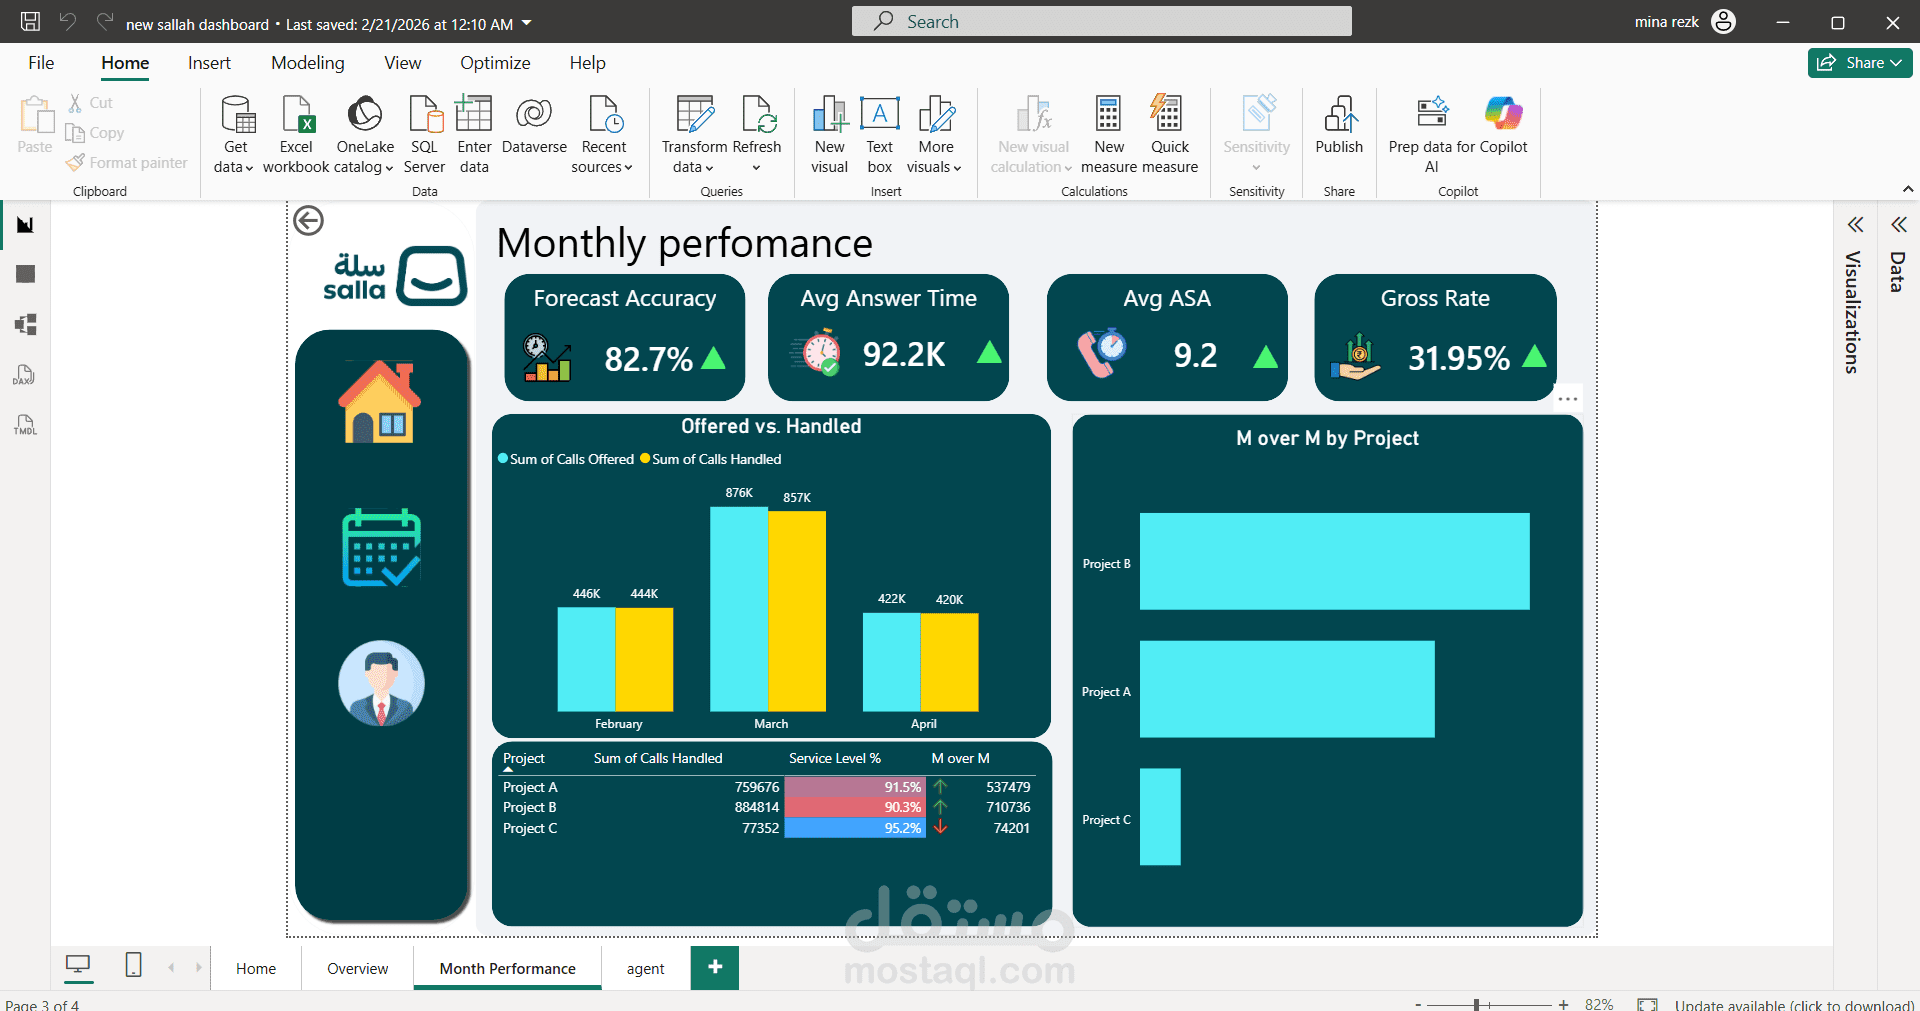
The second page is Monthly Performance. This is where I started building more complex Dax equations. I created an M over M metric—meaning month over month—using CALCULATE and DATE FUNCTIONS to compare each month's performance with the previous month. I also created a Forecast Accuracy metric—now you can see in the table that Project B has a Service Level of 98.2% with an upward-pointing arrow. The Offered vs. Handled chart visually reveals the difference between offered and handled calls.
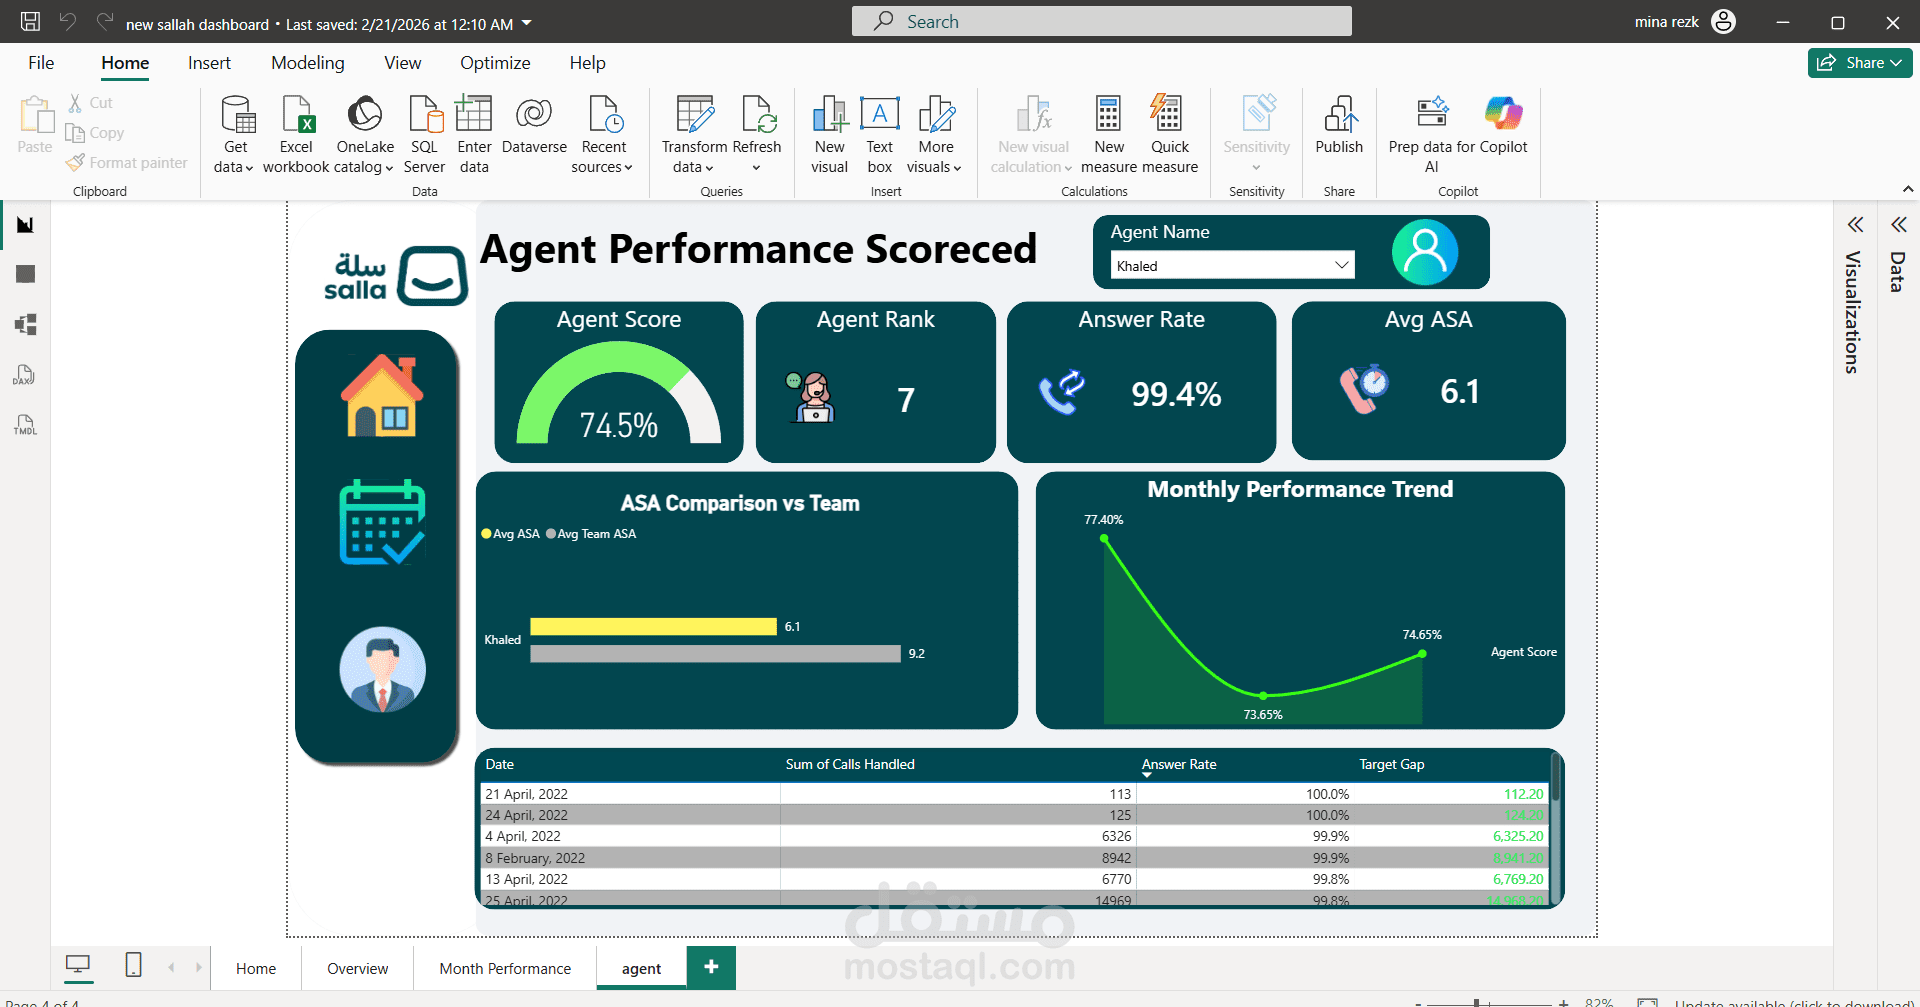
The third and most powerful page is the Agent Performance Scorecard. You select any agent's name from the dropdown and immediately see their Agent Score (in the form of a gauge), their ranking among all agents, their Answer Rate, and their Average ASA. There's also an Average Team ASA metric, which compares an individual's performance to the team's average. The Monthly Performance Trend line shows improvement or decline over the months. This dashboard isn't just numbers and colors—it's a decision-making process that takes seconds instead of hours. From Modeling and Cleaning to the final Dax Measure, everything is built on logic. And that's exactly the difference between a report and a real dashboard.
I hope the dashboard is problem-free, and I need to know your opinions on it. ❤️