Sales Performance
تفاصيل العمل
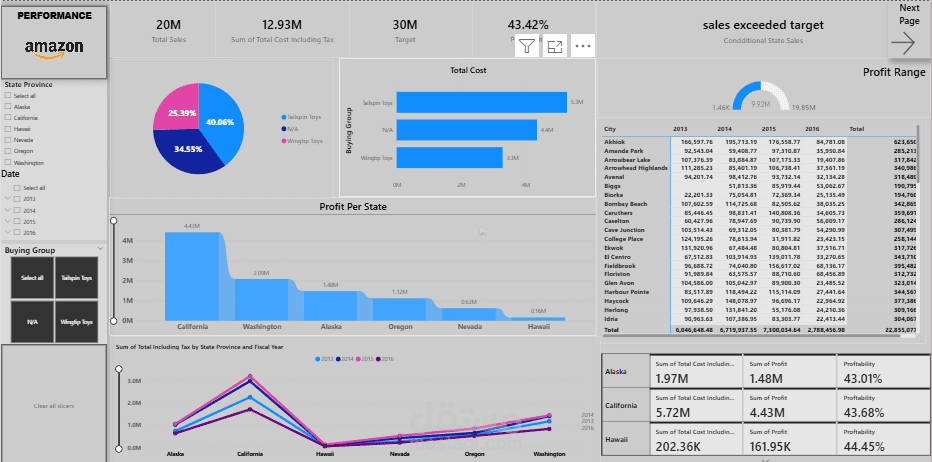
I built this Sales Performance Dashboard from scratch using Power BI, starting with raw data and ending with a clean, interactive dashboard focused on business insights.
What I worked on:
• Cleaned and prepared the data to ensure accuracy
• Built the data model and relationships
• Created DAX measures using calculated measures, VAR, and SWITCH for flexible and dynamic calculations
• Tracked key metrics such as Total Sales, Total Cost (Incl. Tax), Target, and Profitability
• Analyzed profit by state to highlight performance differences
• Compared results across years and buying groups
• Designed an interactive dashboard with KPIs, charts, tables, and slicers for easy analysis