Power BI Project
تفاصيل العمل
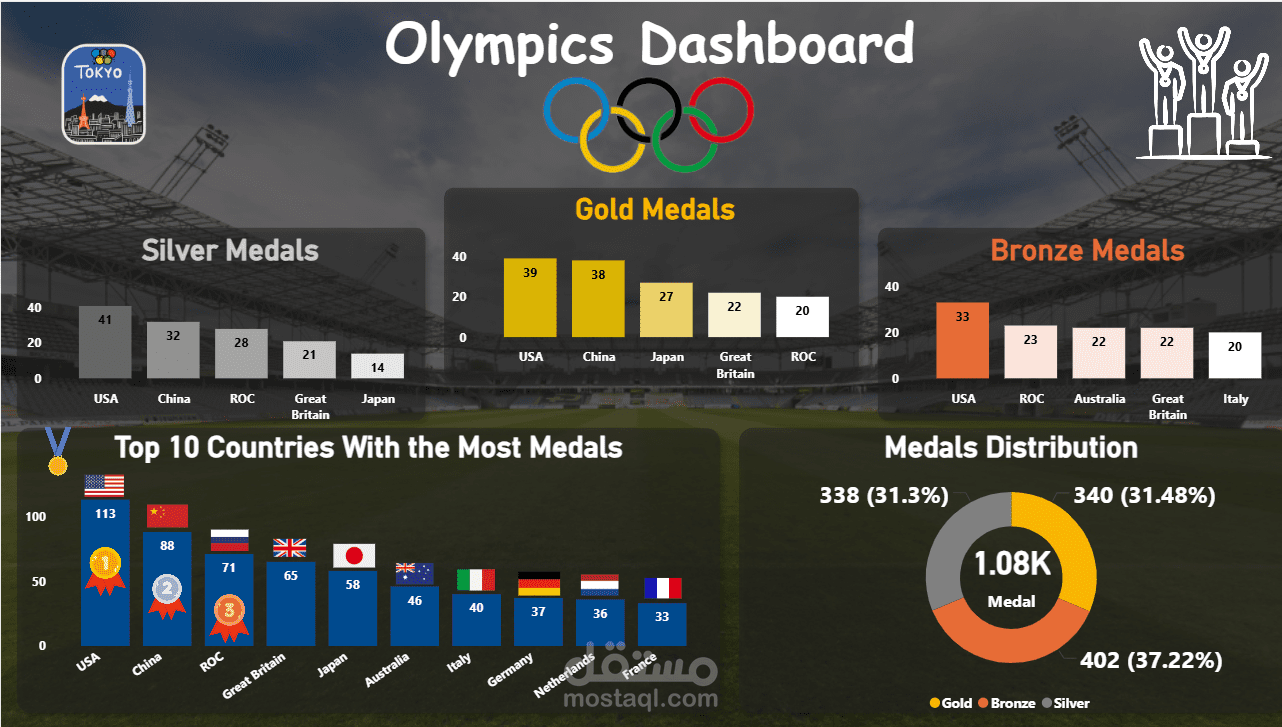
Developed an interactive **Olympics Dashboard using Power BI** to analyze medal performance and country rankings. The dashboard highlights the Top 10 countries with the highest medal counts, detailed breakdown of Gold, Silver, and Bronze medals, and overall medal distribution (1.08K total medals).
Created dynamic visualizations to compare country performance and identify leading nations such as USA, China, and ROC. The project demonstrates strong skills in **data modeling, DAX calculations, KPI analysis, and building clear, insightful visual reports for performance comparison**.