Data Analysis Using Power bi
تفاصيل العمل
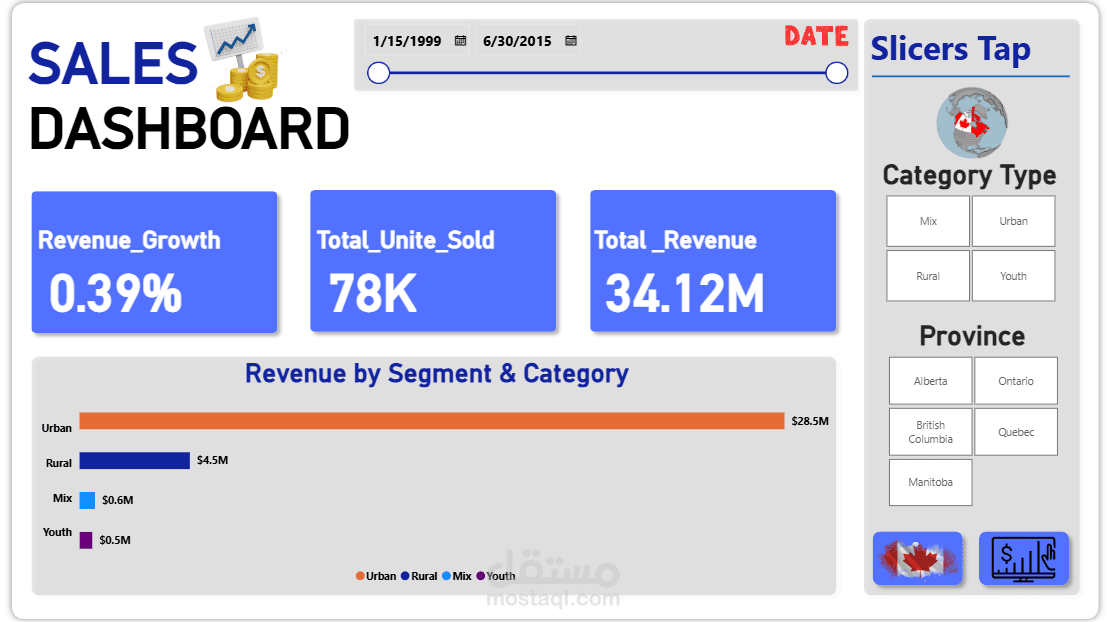
Designed and developed an interactive **Sales Dashboard using Power BI** to analyze revenue performance and business growth. The dashboard provides insights into total revenue ($34M+), units sold (78K), and revenue growth (0.39%).
It includes detailed analysis by segment (Urban, Rural, Mix, Youth), province, manufacturer, and yearly trends. Built dynamic slicers for date filtering and created KPI indicators, revenue targets tracking, and revenue vs. units comparison.
The project demonstrates strong skills in **data modeling, DAX calculations, data visualization, and transforming raw data into actionable business insights**.