Data Insights & Case Study Presentation
تفاصيل العمل
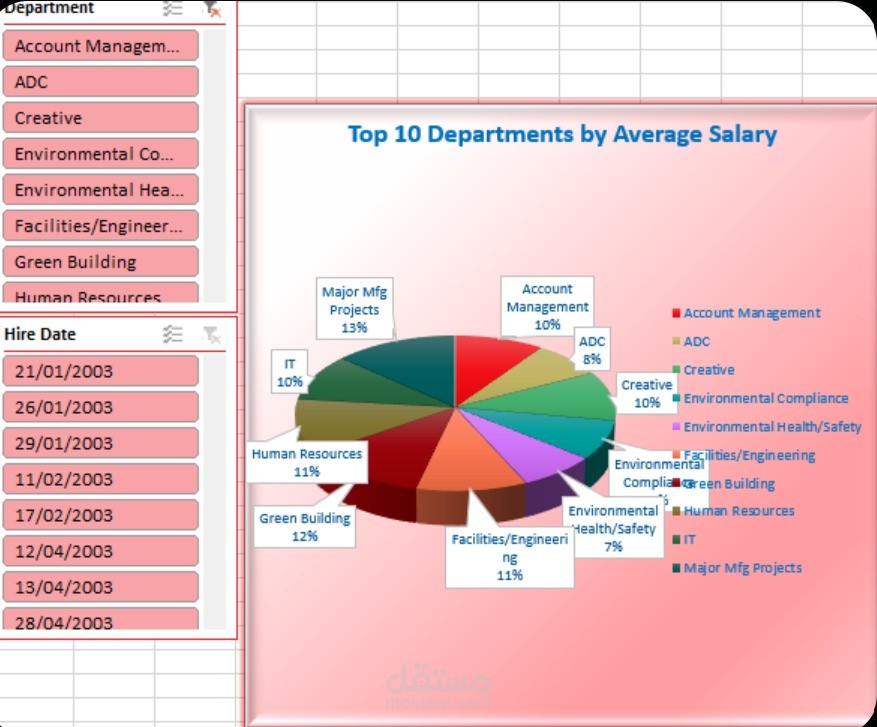
An interactive Excel dashboard designed to analyze employee salary distributions across departments.
Key Highlights:
Top 10 Analysis: Visualizing the highest-earning departments by average salary.
Dynamic Slicers: Interactive filters for "Department" and "Hire Date" for instant data drill-down.
Data Visualization: Professional 3D Pie Chart showcasing budget allocation percentages.