pivot table
تفاصيل العمل
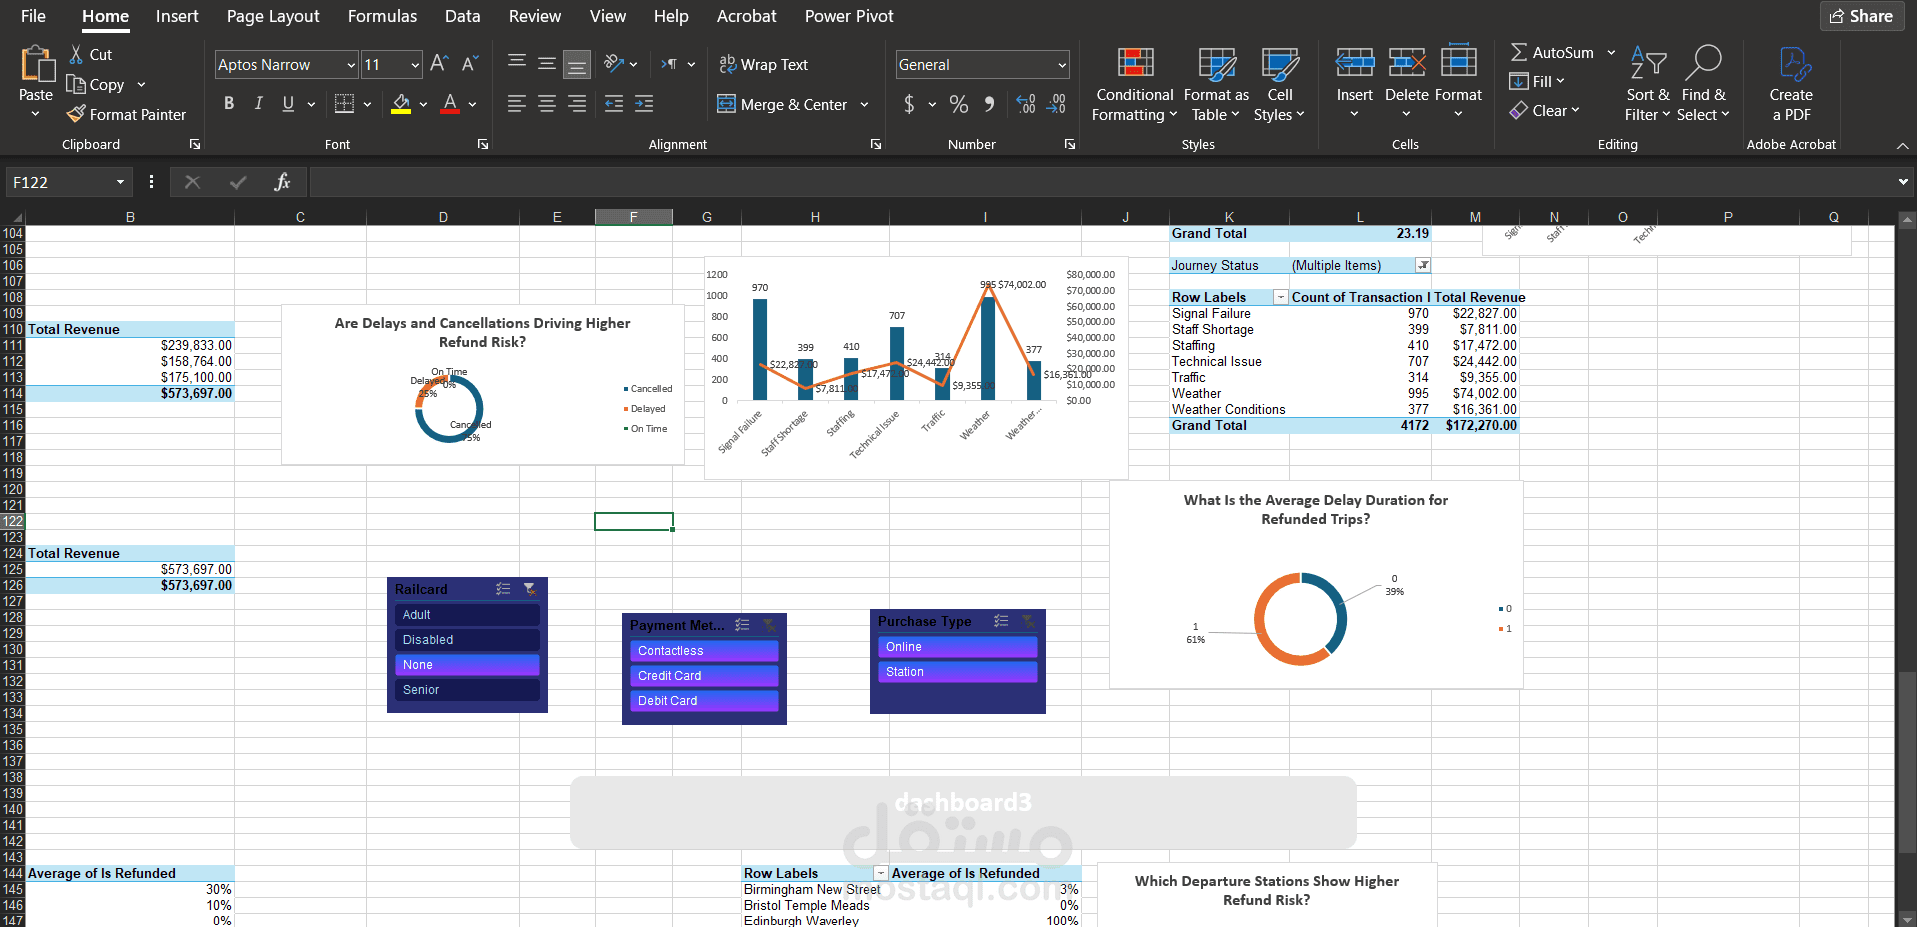
Using Excel Pivot Tables and charts to summarize datasets, analyze key metrics, and identify patterns and trends in the data.
Using Excel Pivot Tables and charts to summarize datasets, analyze key metrics, and identify patterns and trends in the data.