Sales Data Analysis and Professional Visualization using Python
تفاصيل العمل
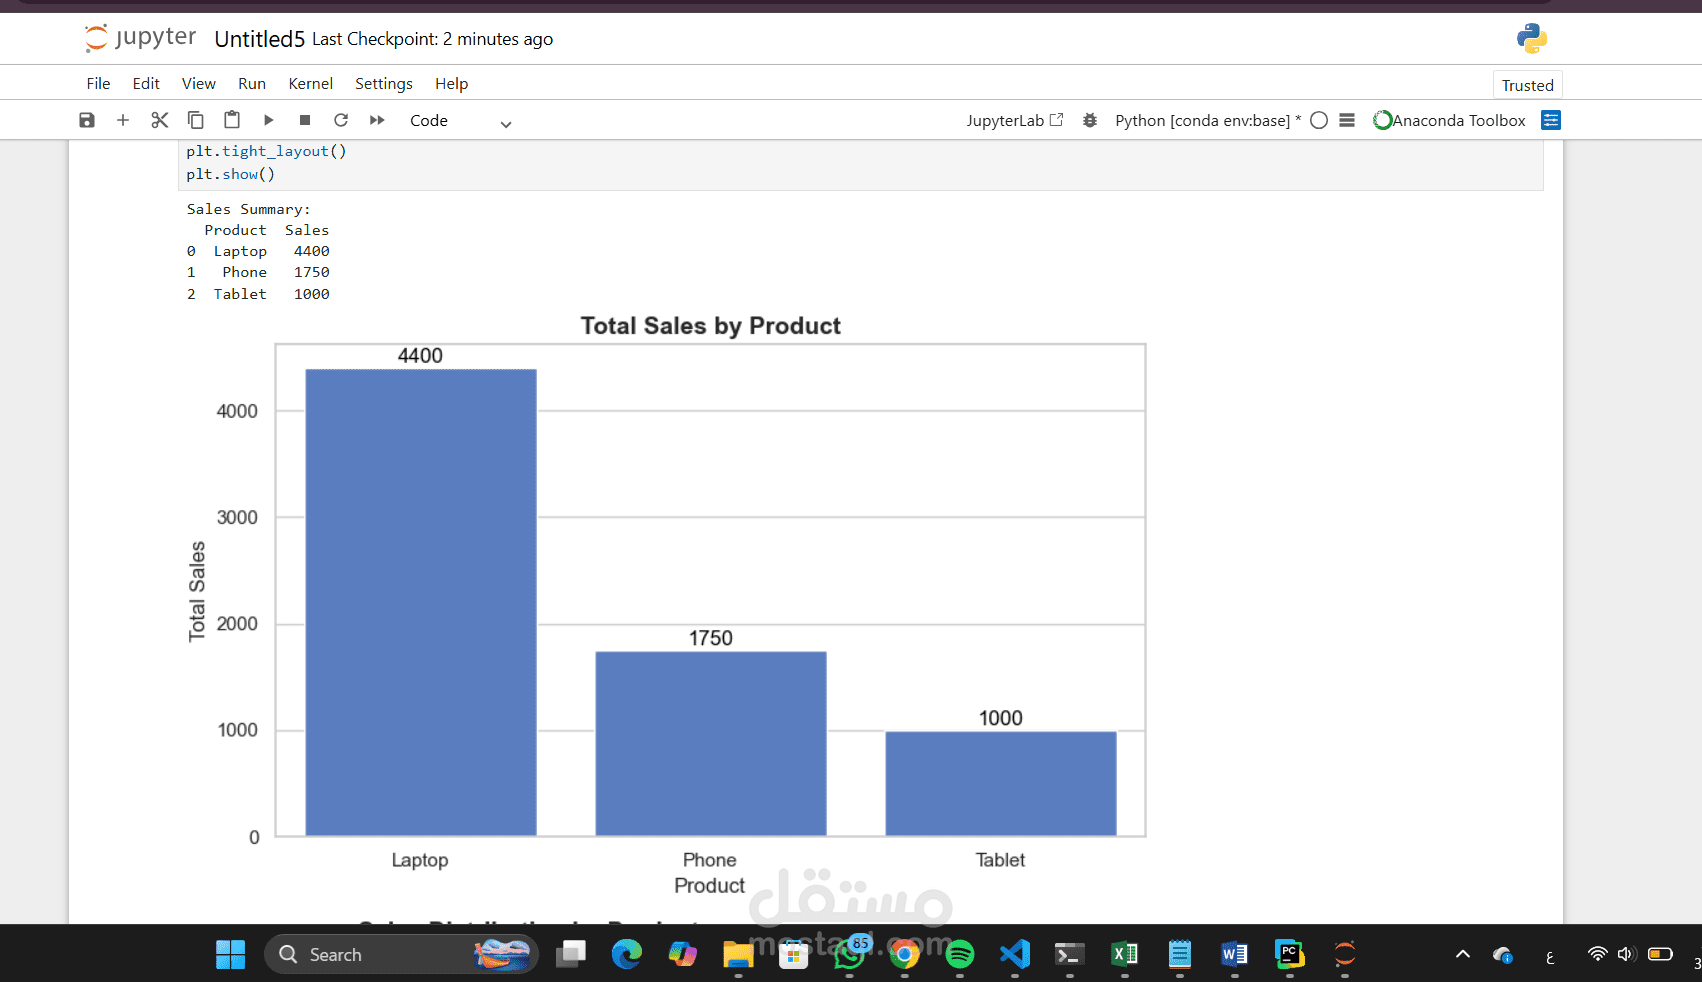
This project performs sales data analysis and produces professional visualizations using Python.
It calculates total sales per product and presents the results using clean and well-formatted bar charts and pie charts.
Features:
Data analysis using pandas
Professional data visualization using matplotlib and seaborn
Bar chart with value labels
Pie chart showing sales distribution
This project demonstrates skills in data analysis and professional data visualization.