تحليل البيانات لموقع تسوق برازيلي
تفاصيل العمل
## Project Overview
This project is divided into three core Jupyter Notebooks, taking the raw CSV data through a complete lifecycle of cleaning, relational database modeling, and interactive visualization.
### 1. Data Cleaning & Business Analysis (`Data_Analysis_Python.ipynb`)
This notebook handles the core data wrangling and feature engineering using `pandas`:
* **Data Integration:** Merging the 9 separate datasets into comprehensive, enriched fact tables (`orders_enriched` and `items_enriched`).
* **Feature Engineering:** Calculating fulfillment delivery times, flagging late deliveries, and mapping Portuguese categories to English.
* **RFM Segmentation:** Segmenting the customer base into Recency, Frequency, and Monetary (RFM) cohorts to identify "Champions," "Loyal," and "At Risk" users.
* **Outputs:** Generates clean CSV files (`orders_enriched.csv`, `items_enriched.csv`, `rfm_customers.csv`) for downstream reporting.
### 2. SQL Analytics & Database Setup (`EDA_SQL.ipynb`)
This notebook translates the relational CSV data into a functional `SQLite` database (`olist_analytics.sqlite`):
* **DB Creation:** Automates the ingestion of CSVs into raw SQL tables with optimized indexing.
* **SQL-Based EDA:** Executes complex queries to analyze dataset scale, monthly revenue trends, payment distributions, and state-by-state logistics performance.
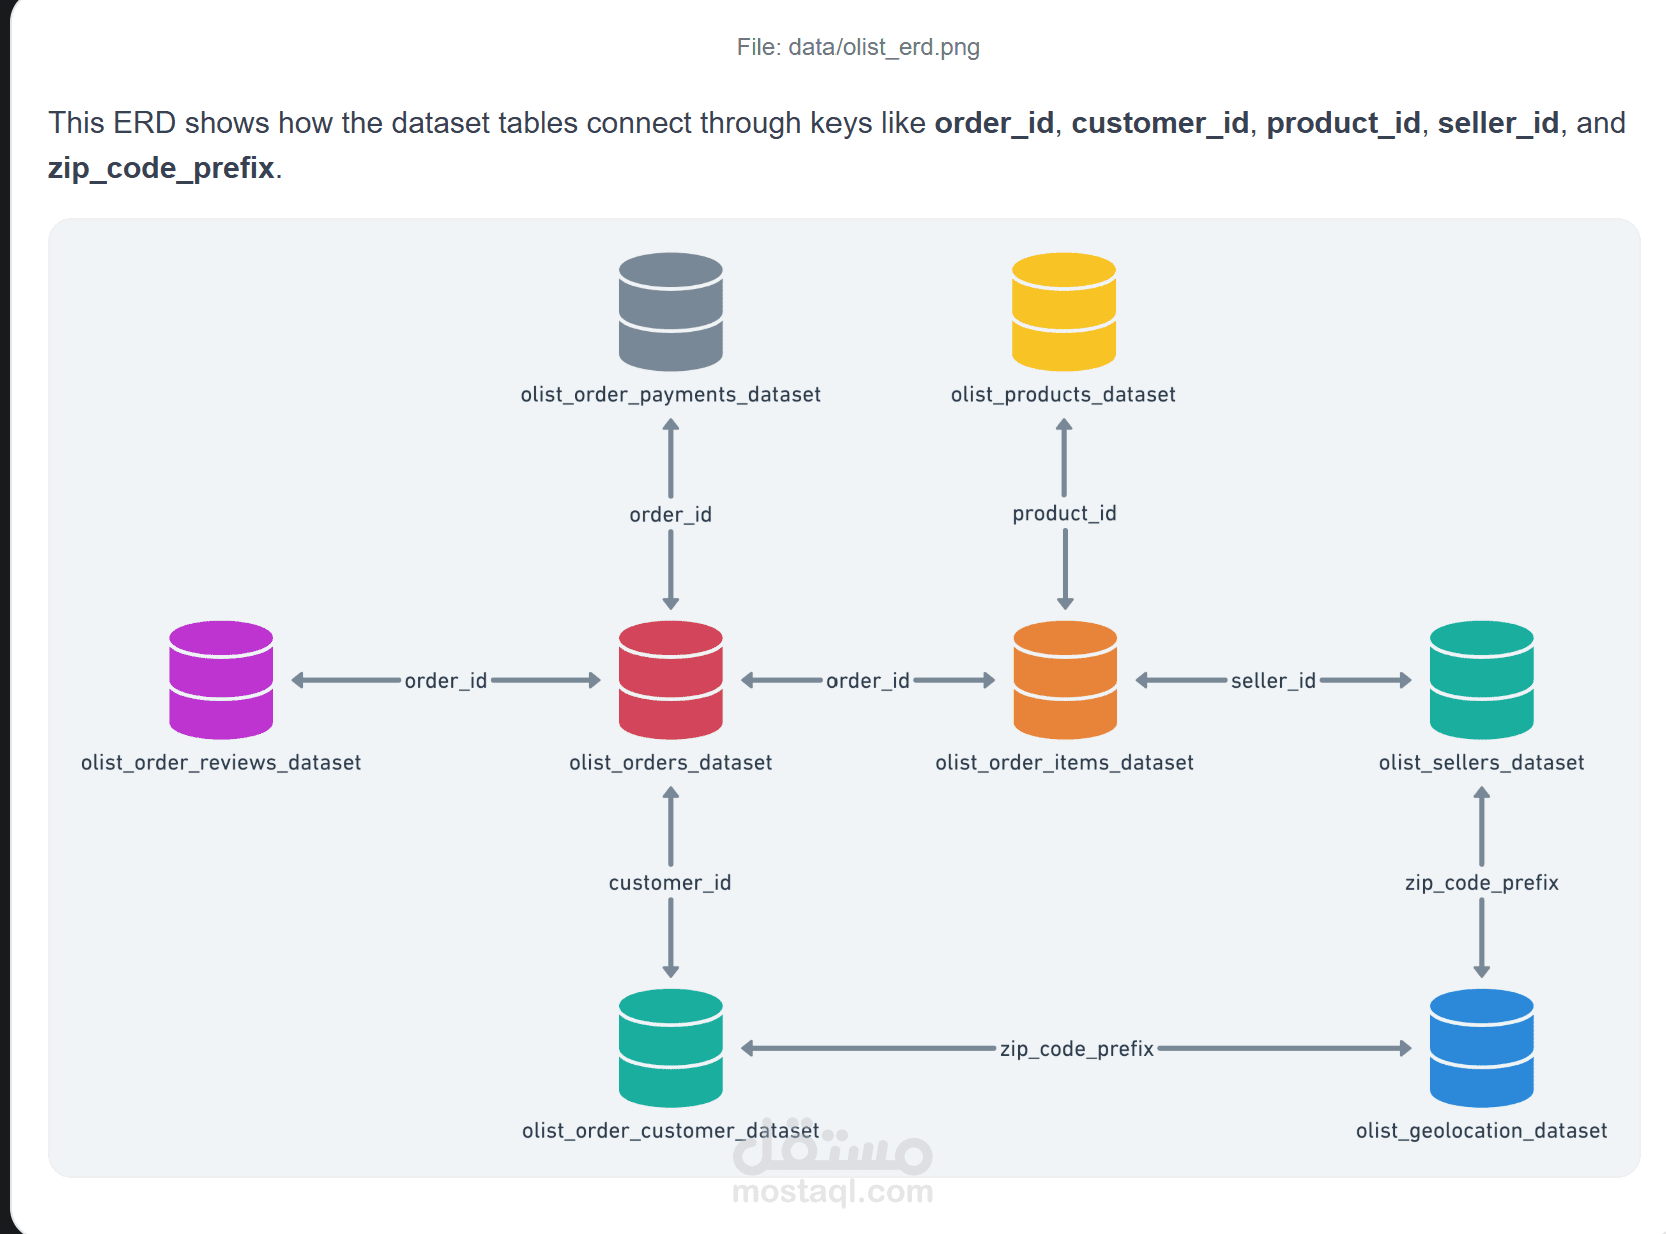
* **Data Modeling:** Generates an Entity-Relationship Diagram (ERD) to visualize how tables connect via primary and foreign keys.
### 3. Interactive Dashboard (`Dashboard_Plotly_ipywidgets.ipynb`)
A fully interactive dashboard rendered directly inside the Jupyter environment using `ipywidgets` and `matplotlib`:
* **Dynamic Filtering:** Users can slice data by Date Range, State, Category, and RFM Segment.
* **Live KPI Cards:** Tracks Revenue, Total Orders, Average Order Value (AOV), Average Review Score, and Late Delivery Rates.
* **Visual Tabs:** Separates insights into **Sales** (revenue trends, top categories), **Operations** (delivery distributions, late rates), and **Customers** (state revenues, segment counts).
---
## ? Key Insights & Recommendations
Through this analysis, several actionable business intelligence insights were discovered:
* **Logistics dictate Customer Satisfaction:** The single highest-impact lever for ratings is delivery time. On-time deliveries average a 4.29/5 rating, while late deliveries plummet to 2.56/5. Deliveries taking longer than 22 days see late rates spike to 31.7% and heavily damage the brand's reputation.
* **Geographic Bottlenecks:** Logistics performance is highly dependent on the customer's state. While SP drives the most volume, states like CE, BA, PA, and RJ experience chronic shipping delays (up to 14.7% late rates). *Recommendation: Optimize regional carrier hubs or renegotiate SLAs for these specific lanes.*
* **Seller Concentration (The Pareto Principle):** Just 18.1% of sellers (561 out of 3,095) generate roughly 80% of the platform's GMV. *Recommendation: Implement a VIP seller program for top performers, while aggressively auditing high-volume sellers who have high late-dispatch rates.*
* **Category Red Flags:** While Health & Beauty drives massive revenue, the "Office Furniture" category is underperforming. It has the lowest average review score (3.48), high freight costs, and long fulfillment times (19 days). *Recommendation: Enforce stricter packaging/dimension rules for this category or introduce specialized freight options.*
* **Retention Upside:** The RFM analysis reveals that the vast majority of Olist users in this dataset are one-time buyers. *Recommendation: Deploy time-based retention coupons 7-14 days post-delivery to convert single-purchasers into repeat buyers.*
---
## ?️ Technology Stack
* **Python:** The core programming language used.
* **Pandas & NumPy:** For data manipulation, aggregation, and feature engineering.
* **SQLite:** For relational database structuring and querying.
* **Matplotlib:** For static data visualizations and charting.
* **ipywidgets:** For building the interactive, event-driven dashboard inside Jupyter.