? Mental Health in Tech – Tableau Dashboard Project
تفاصيل العمل
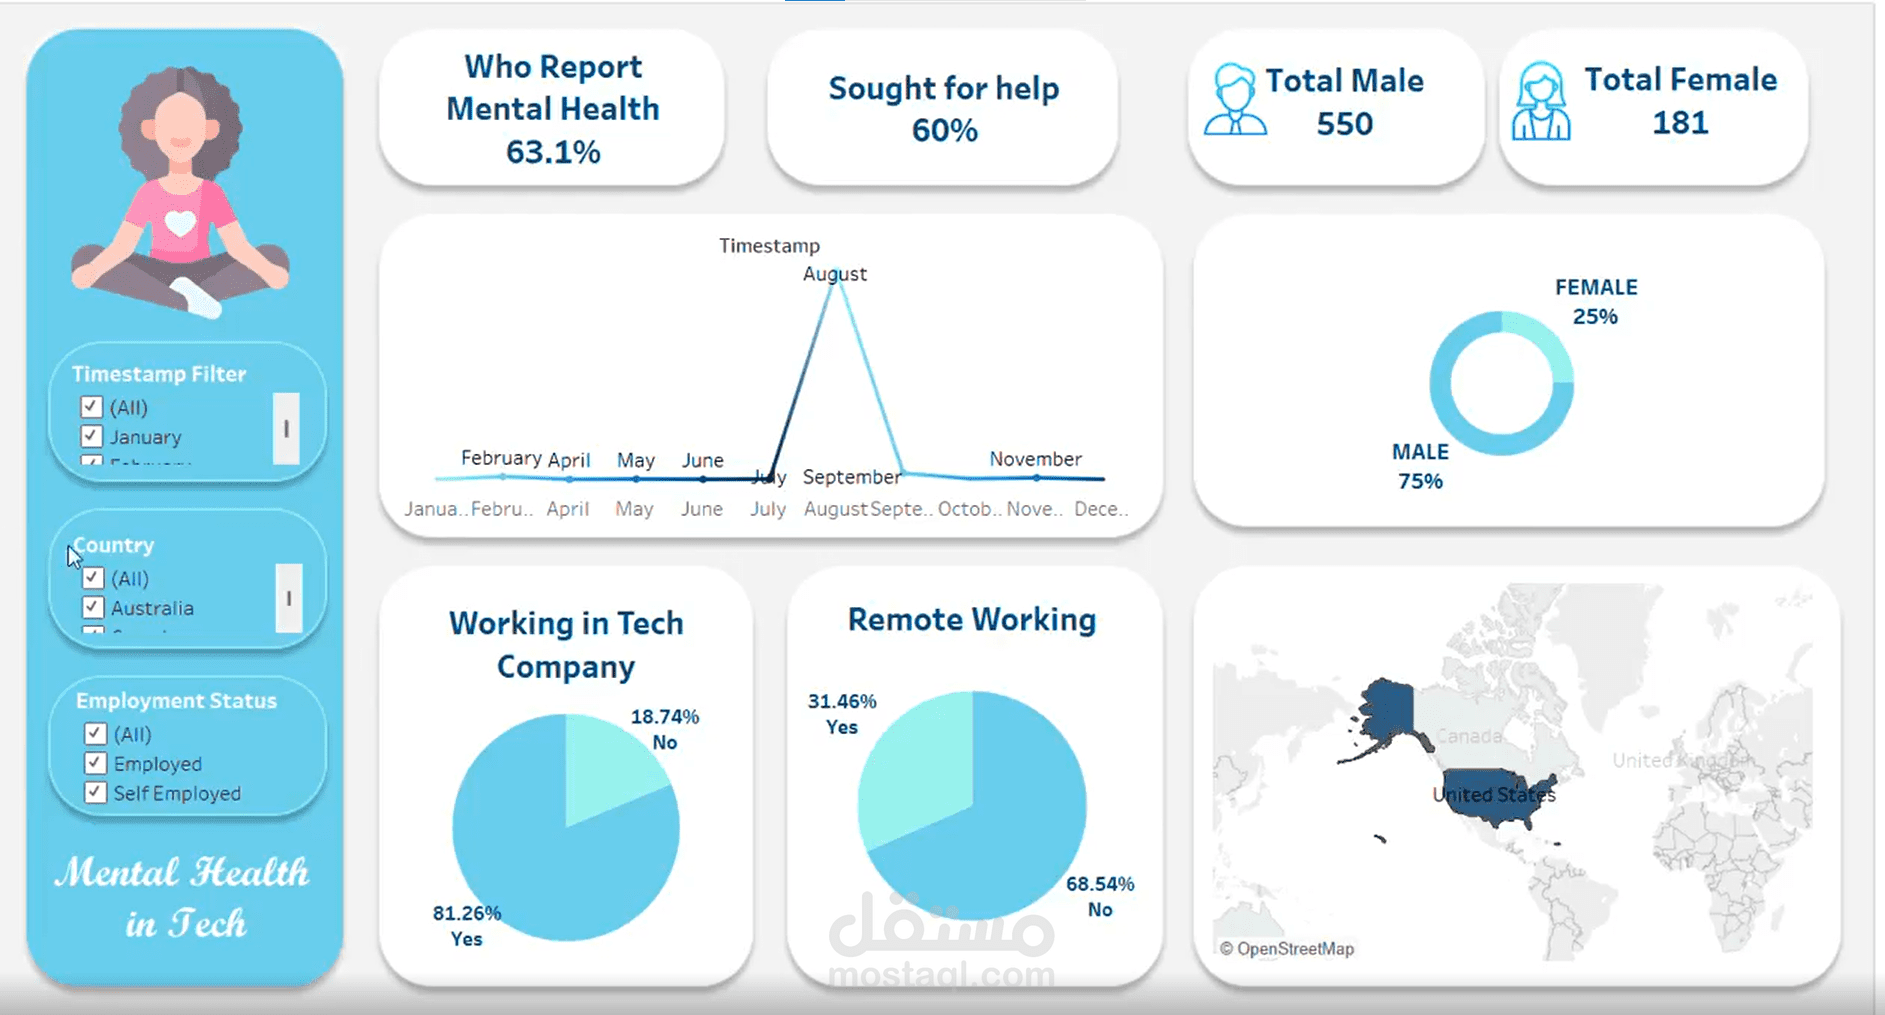

This project analyzes mental health trends within the tech industry using interactive dashboards built in Tableau. The analysis explores key insights such as the percentage of individuals reporting mental health concerns, those who sought professional help, gender distribution, remote work impact, and employment status.
The dashboard includes dynamic filters (timestamp, country, employment status) to allow users to explore the data across different dimensions. Visualizations such as KPI cards, pie charts, line trends, and geographic maps were designed to present insights clearly and support data-driven understanding of workplace mental health patterns.
The goal of this project was to transform raw survey data into meaningful, easy-to-interpret visual insights that highlight important trends in the tec