Executive Sales Performance Dashboard
تفاصيل العمل
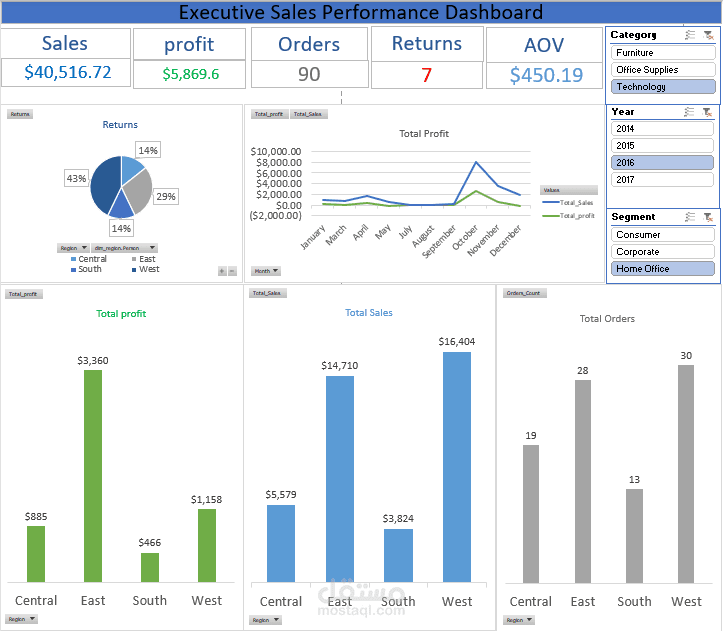
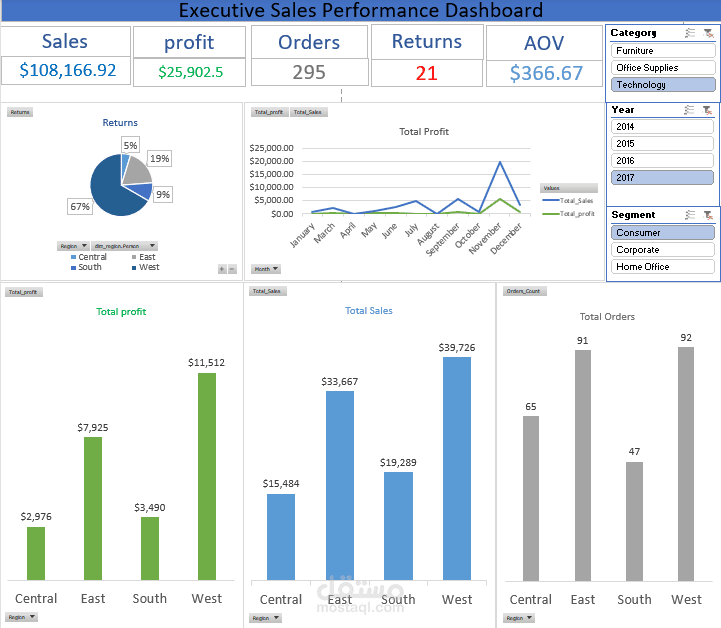
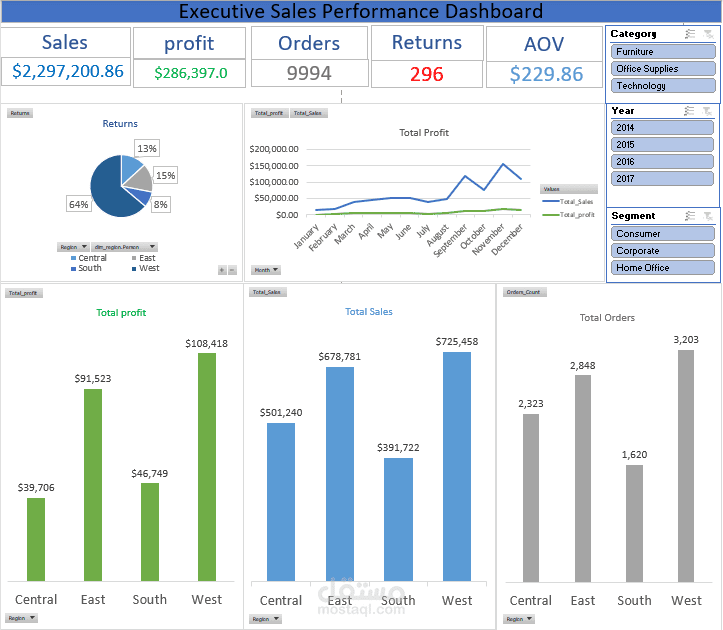
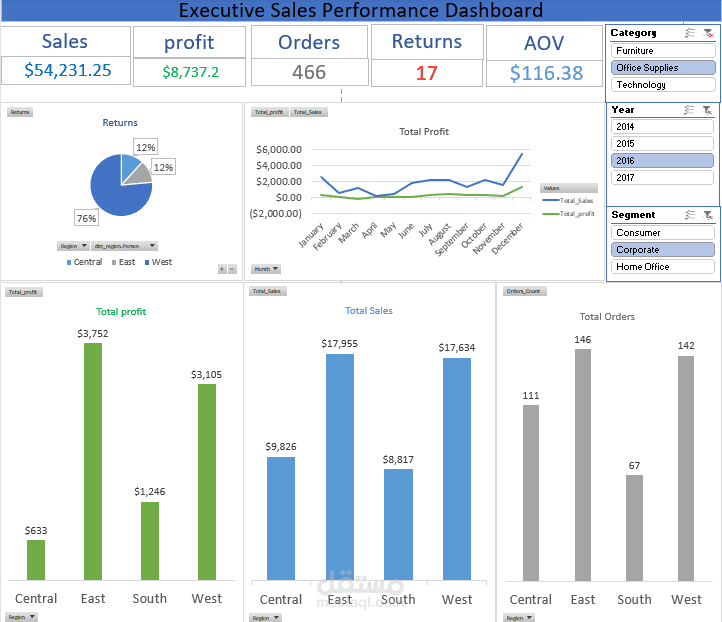
Executive Sales Performance Dashboard | Data Analysis Project
After 7 weeks in the DEPI, I’m excited to share my first complete sales dashboard, built to tell a clear business story
This project helped me understand how to transform raw data into meaningful insights that support decision-making.
? What this dashboard focuses on:
Key sales performance indicators
Trends and seasonality analysis
Regional performance comparison
Returns analysis and risk identification
Interactive filtering by year, category, and segment
? Tools & Skills Applied:
Power Query for data cleaning and transformation
DAX for calculated KPIs and measures
Excel (Pivot Tables, Charts, Slicers)
Dashboard Design