Pharmacy Performance Analysis Dashboard
تفاصيل العمل
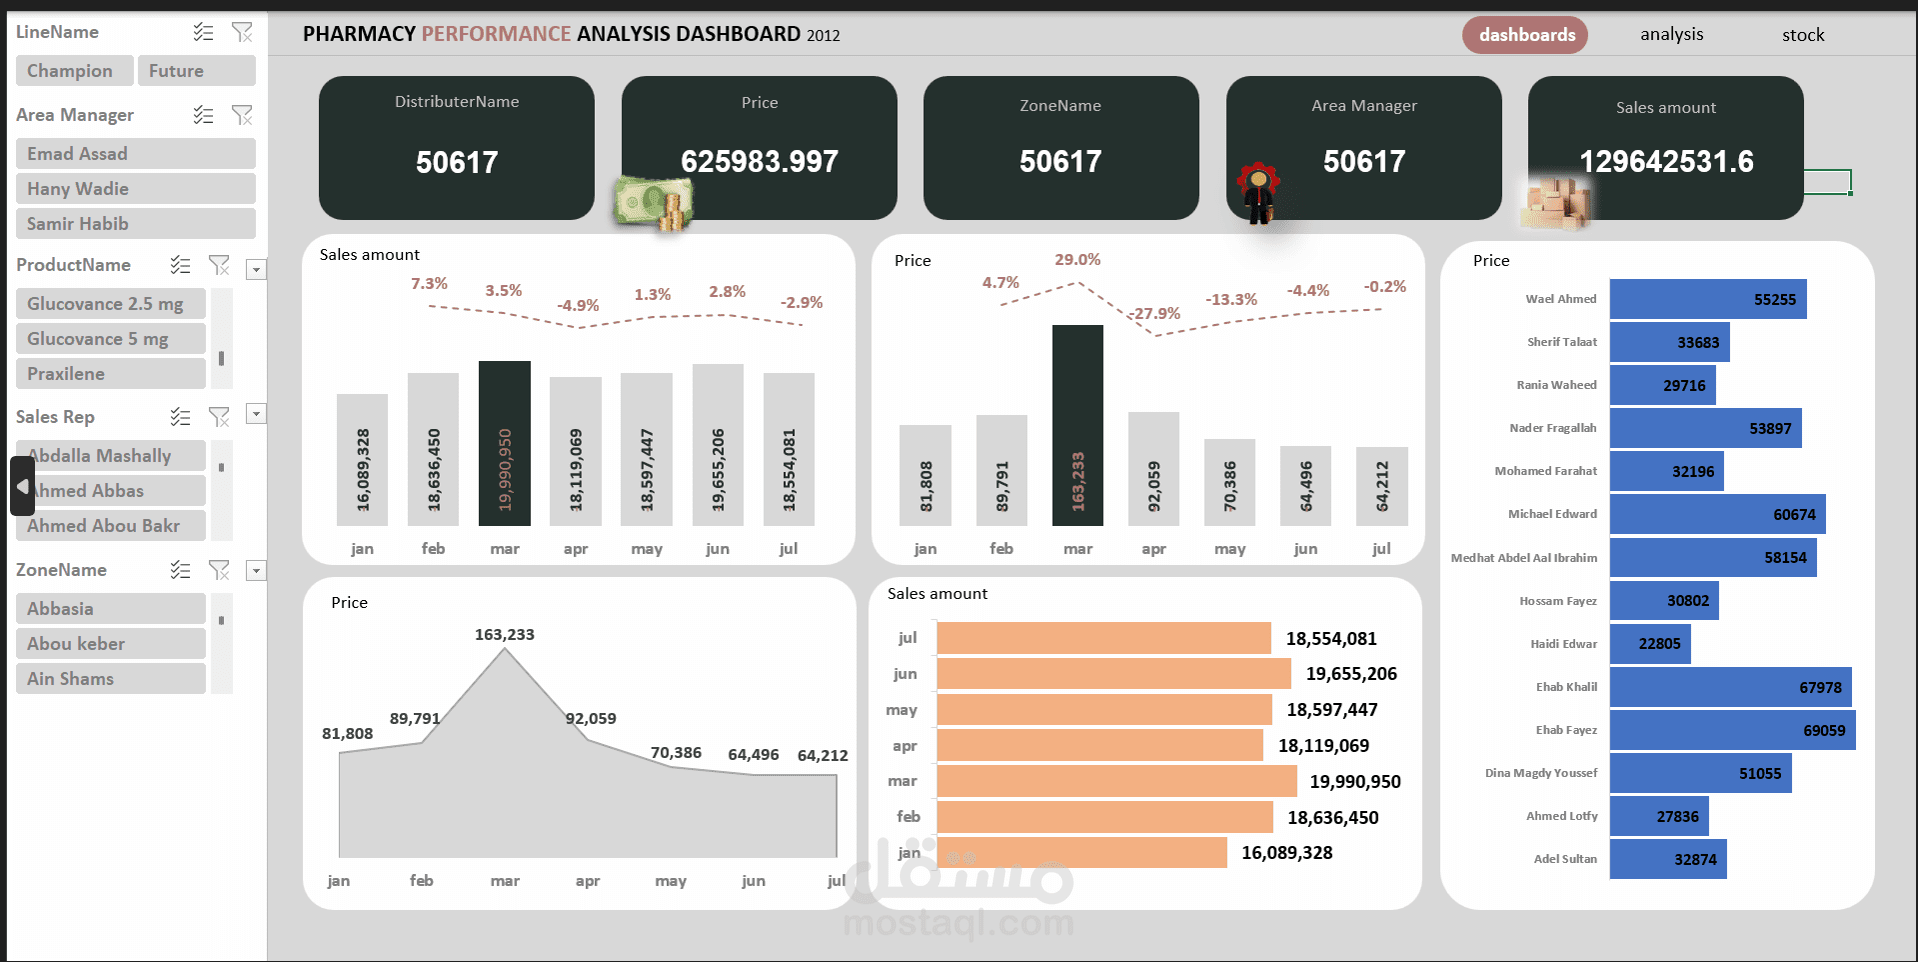
An interactive Pharmacy Performance Analysis Dashboard built to monitor and evaluate sales performance, pricing trends, and sales team productivity across multiple zones and distributors.
The dashboard provides a complete monthly performance overview for 2012, enabling data-driven decisions for pharmacy management and area managers.
? Key Insights & Analysis
Total Sales Amount
Total Price Value
Distributor Performance
Zone-Level Analysis
Area Manager Monitoring
Sales Representative Performance Ranking
Monthly Sales Trend Analysis
Monthly Price Trend Analysis
Growth Percentage Tracking
? Tools & Techniques Used
Data Cleaning & Preparation
KPI Cards for executive summary
Time Series Analysis (Monthly Trends)
Percentage Growth Calculation
Performance Comparison
Interactive Filters (Line Name, Area Manager, Product, Sales Rep, Zone)
Dynamic Visualizations
? Business Value
Identifies top-performing and underperforming sales representatives.
Detects seasonal sales patterns.
Tracks pricing fluctuations and their impact on revenue.
Enables zone-based performance comparison.
Supports management in optimizing sales strategy and distribution efficiency.
? What This Project Demonstrates
Strong analytical thinking.
KPI design for business reporting.
Ability to transform raw sales data into executive-level insights.
Performance monitoring and sales optimization analysis.
Dashboard storytelling for decision-makers.