Humanitarian Needs & Household Analysis Dashboard
تفاصيل العمل
Project Description
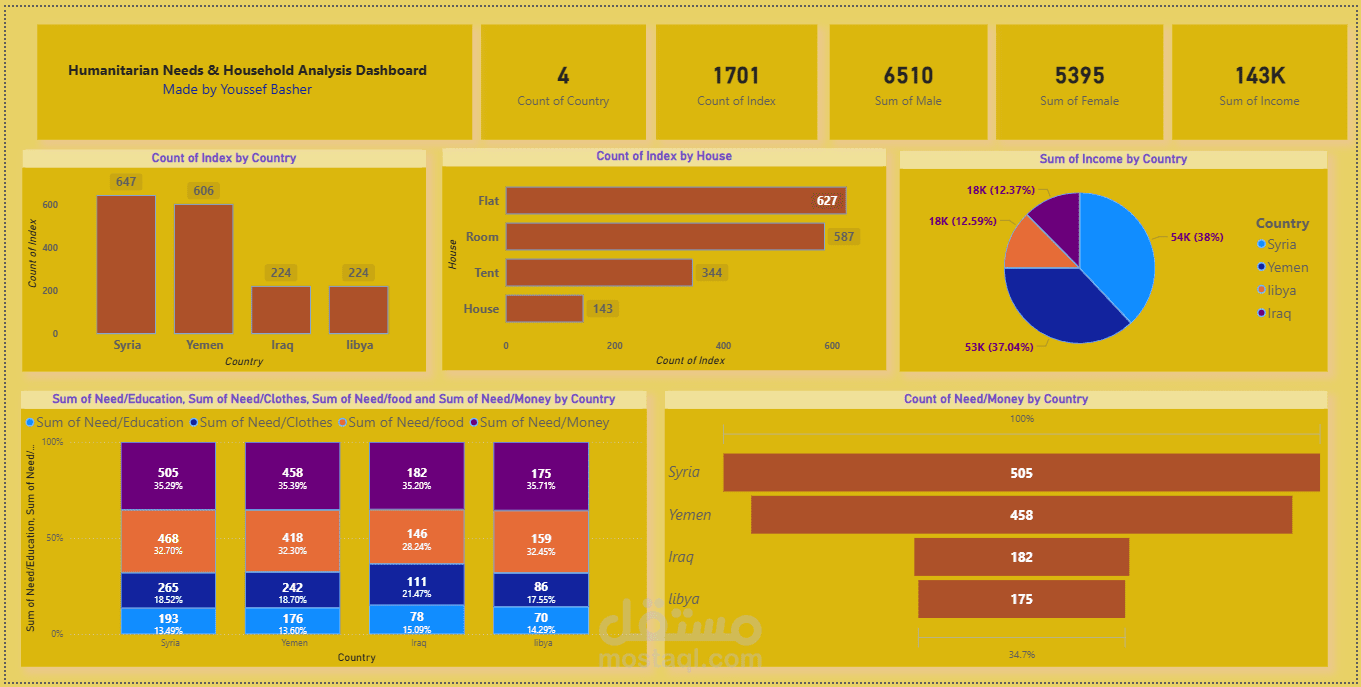
An advanced interactive dashboard built using Power BI to analyze humanitarian household data across four countries.
The dashboard transforms raw survey data into dynamic, decision-ready insights using Power BI’s data modeling and visualization capabilities.
? Key Insights Provided
Count of Households by Country
Income Distribution by Country
Housing Type Breakdown
Gender Distribution
Needs Analysis (Education, Clothes, Food, Money)
Comparative Country-Level Analysis
? Tools & Skills Used
Power BI Data Modeling
Relationships (Fact & Dimension Tables)
DAX Measures
KPI Cards
Interactive Visualizations
Percentage Contribution Analysis
Drill-down & Filtering
? Business Impact
Enables humanitarian organizations to identify priority countries.
Highlights which type of support is most needed (e.g., money vs food).
Helps compare economic conditions between countries.
Supports data-driven allocation of aid resources.
? What This Project Demonstrates
Strong understanding of Data Modeling (Fact & Dimension structure).
Ability to build scalable BI dashboards.
DAX calculations and measure creation.
Data storytelling and executive-level reporting.
Transforming Excel-based reporting into a professional BI solution.