Humanitarian Needs & Household Analysis Dashboard
تفاصيل العمل
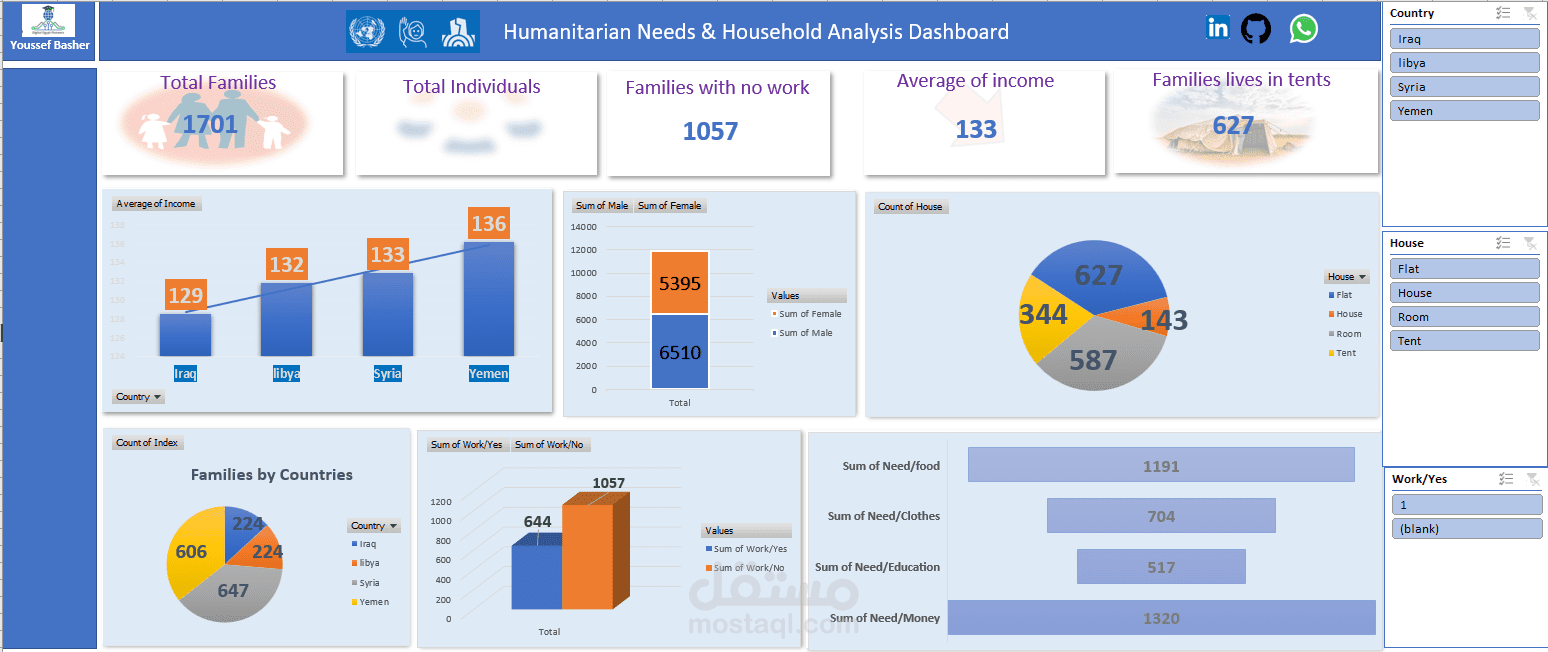
Project Description
Humanitarian Needs & Household Analysis Dashboard built using Microsoft Excel to analyze household conditions across four countries (Syria, Yemen, Iraq, and Libya).
This dashboard provides interactive insights into:
Total Families and Total Individuals
Average Income by Country
Families with No Work
Housing Types Distribution (Flat, House, Room, Tent)
Gender Distribution (Male vs Female)
Household Needs (Food, Clothes, Education, Money)
? Tools & Techniques Used
Pivot Tables
Pivot Charts
GETPIVOTDATA
Slicers for dynamic filtering (Country, House Type, Work Status)
KPI Cards using formulas
Data Aggregation & Cleaning
? Business Value
Enabled quick comparison between countries.
Helped identify high-need areas (e.g., money and food needs).
Highlighted unemployment impact on households.
Provided a structured overview of housing conditions.
Allowed decision-makers to filter and explore data interactively.
? What This Project Demonstrates
Strong understanding of Excel Data Modeling.
Ability to convert raw data into actionable insights.
KPI building and dashboard structuring.
Interactive reporting using Slicers.
Visual storytelling using charts.