air quality
تفاصيل العمل
This notebook presents a complete machine learning pipeline for predicting NO₂ (nitrogen dioxide) concentration in the air using the Air Quality UCI dataset. The workflow includes:
Data Loading & Cleaning: Loads the dataset, replaces missing values (-200 with NaN), removes unnamed columns, merges date and time, and interpolates missing timestamps.
Exploratory Data Analysis (EDA): Visualizes NO₂ trends, distribution, correlation heatmap, and hourly seasonality to understand patterns and feature relationships.
Feature Engineering: Creates time-based features (hour, day, month, weekend), lag features (1–24 hours), rolling statistics (mean and standard deviation over windows), interaction terms, and trend indicators.
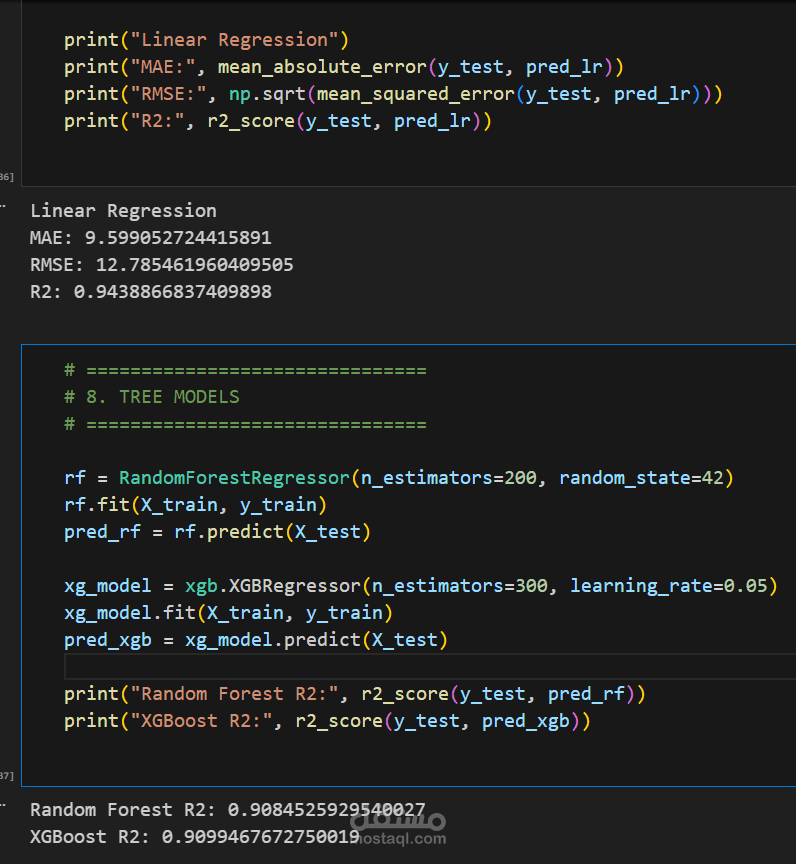
Modeling: Trains and evaluates multiple models including Linear Regression (baseline), Random Forest, and XGBoost. Hyperparameter tuning is performed using GridSearchCV with time-series cross-validation.
Evaluation: Compares models using MAE, RMSE, and R². Visualizes actual vs predicted values and feature importance using SHAP and bar plots.
Forecasting: Implements a simple recursive forecasting function to predict NO₂ for the next 24 hours.
Goal: Build and compare predictive models to forecast NO₂ levels using historical air quality and engineered temporal features.