Sales Performance & Profitability Dashboard – Power BI
تفاصيل العمل
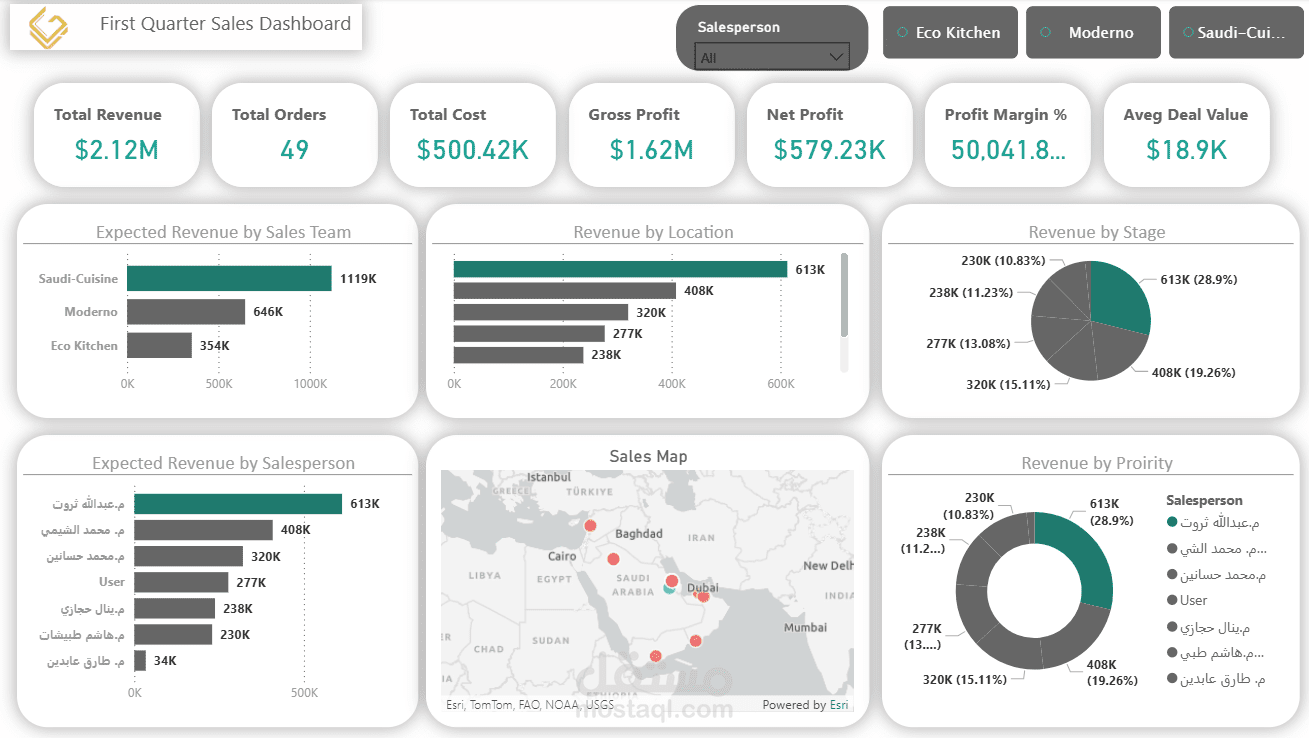
This project presents a comprehensive sales performance and profitability dashboard developed using Microsoft Power BI.
The dashboard provides a complete overview of business performance, including revenue, orders, cost, gross profit, and net profit. It allows decision makers to quickly analyze sales trends and identify top-performing teams and salespeople.
Key features include:
• KPI cards showing total revenue, orders, cost, gross profit, net profit, and profit margin
• Revenue analysis by sales team and branch
• Sales performance by salesperson
• Geographic sales distribution using an interactive map
• Revenue breakdown by sales stage and priority
• Dynamic filters for sales teams and salespeople
This dashboard helps businesses monitor financial performance, track sales activities, and make data-driven decisions.
Tools Used:
• Microsoft Power BI
• Data Modeling
• DAX Measures
• Interactive Data Visualization