Churn Analysis Dashboard
تفاصيل العمل
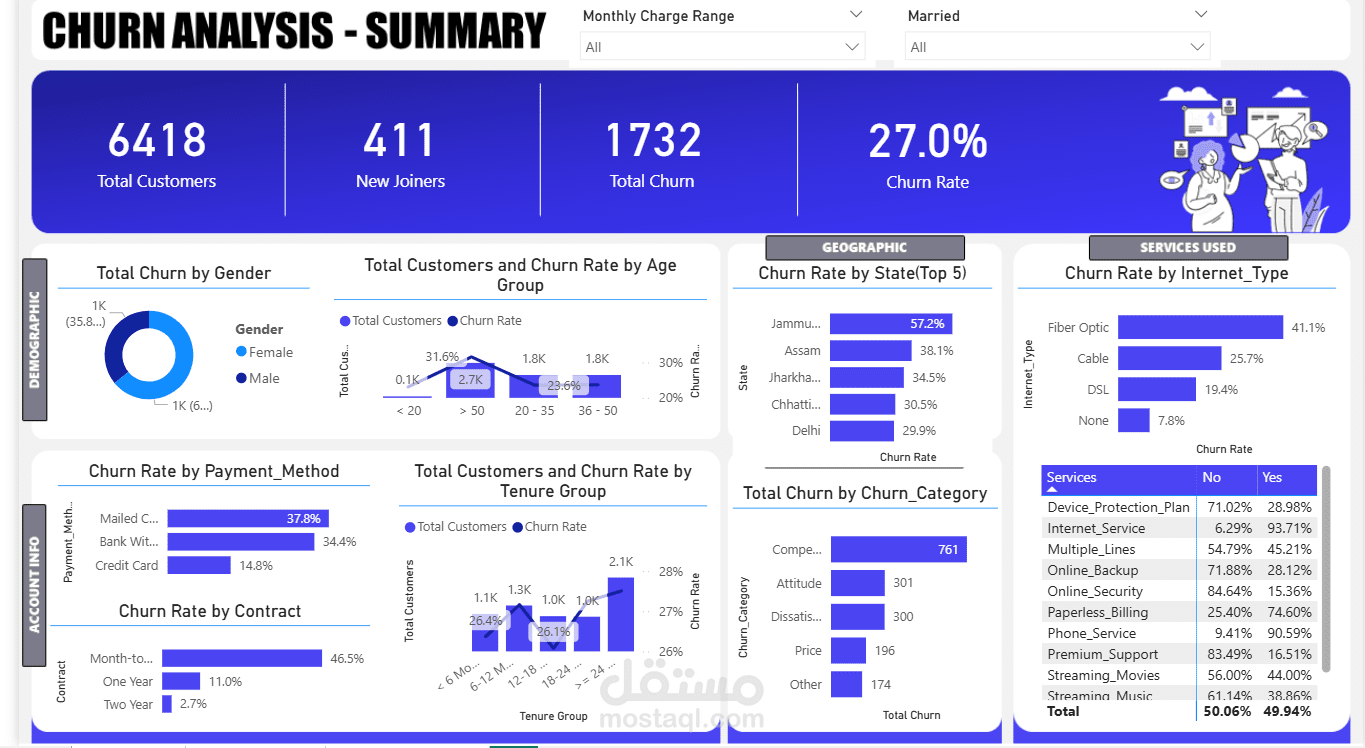

I developed an interactive Churn Analysis Dashboard using Power BI.
Cleaned and transformed the customer dataset for analysis.
Created key KPIs including Total Customers, New Joiners, Total Churn, and Churn Rate.
Built interactive filters (Monthly Charge Range and Marital Status) for dynamic data exploration.
Analyzed churn patterns across demographics (gender, age groups).
Developed visualizations to track churn by state, internet type, payment method, and contract type.
Created insights on churn behavior based on tenure groups and service usage.
Designed a clear and structured dashboard layout to highlight key churn drivers and support decision-making.