https://url-shortener.me/DHI4
تفاصيل العمل
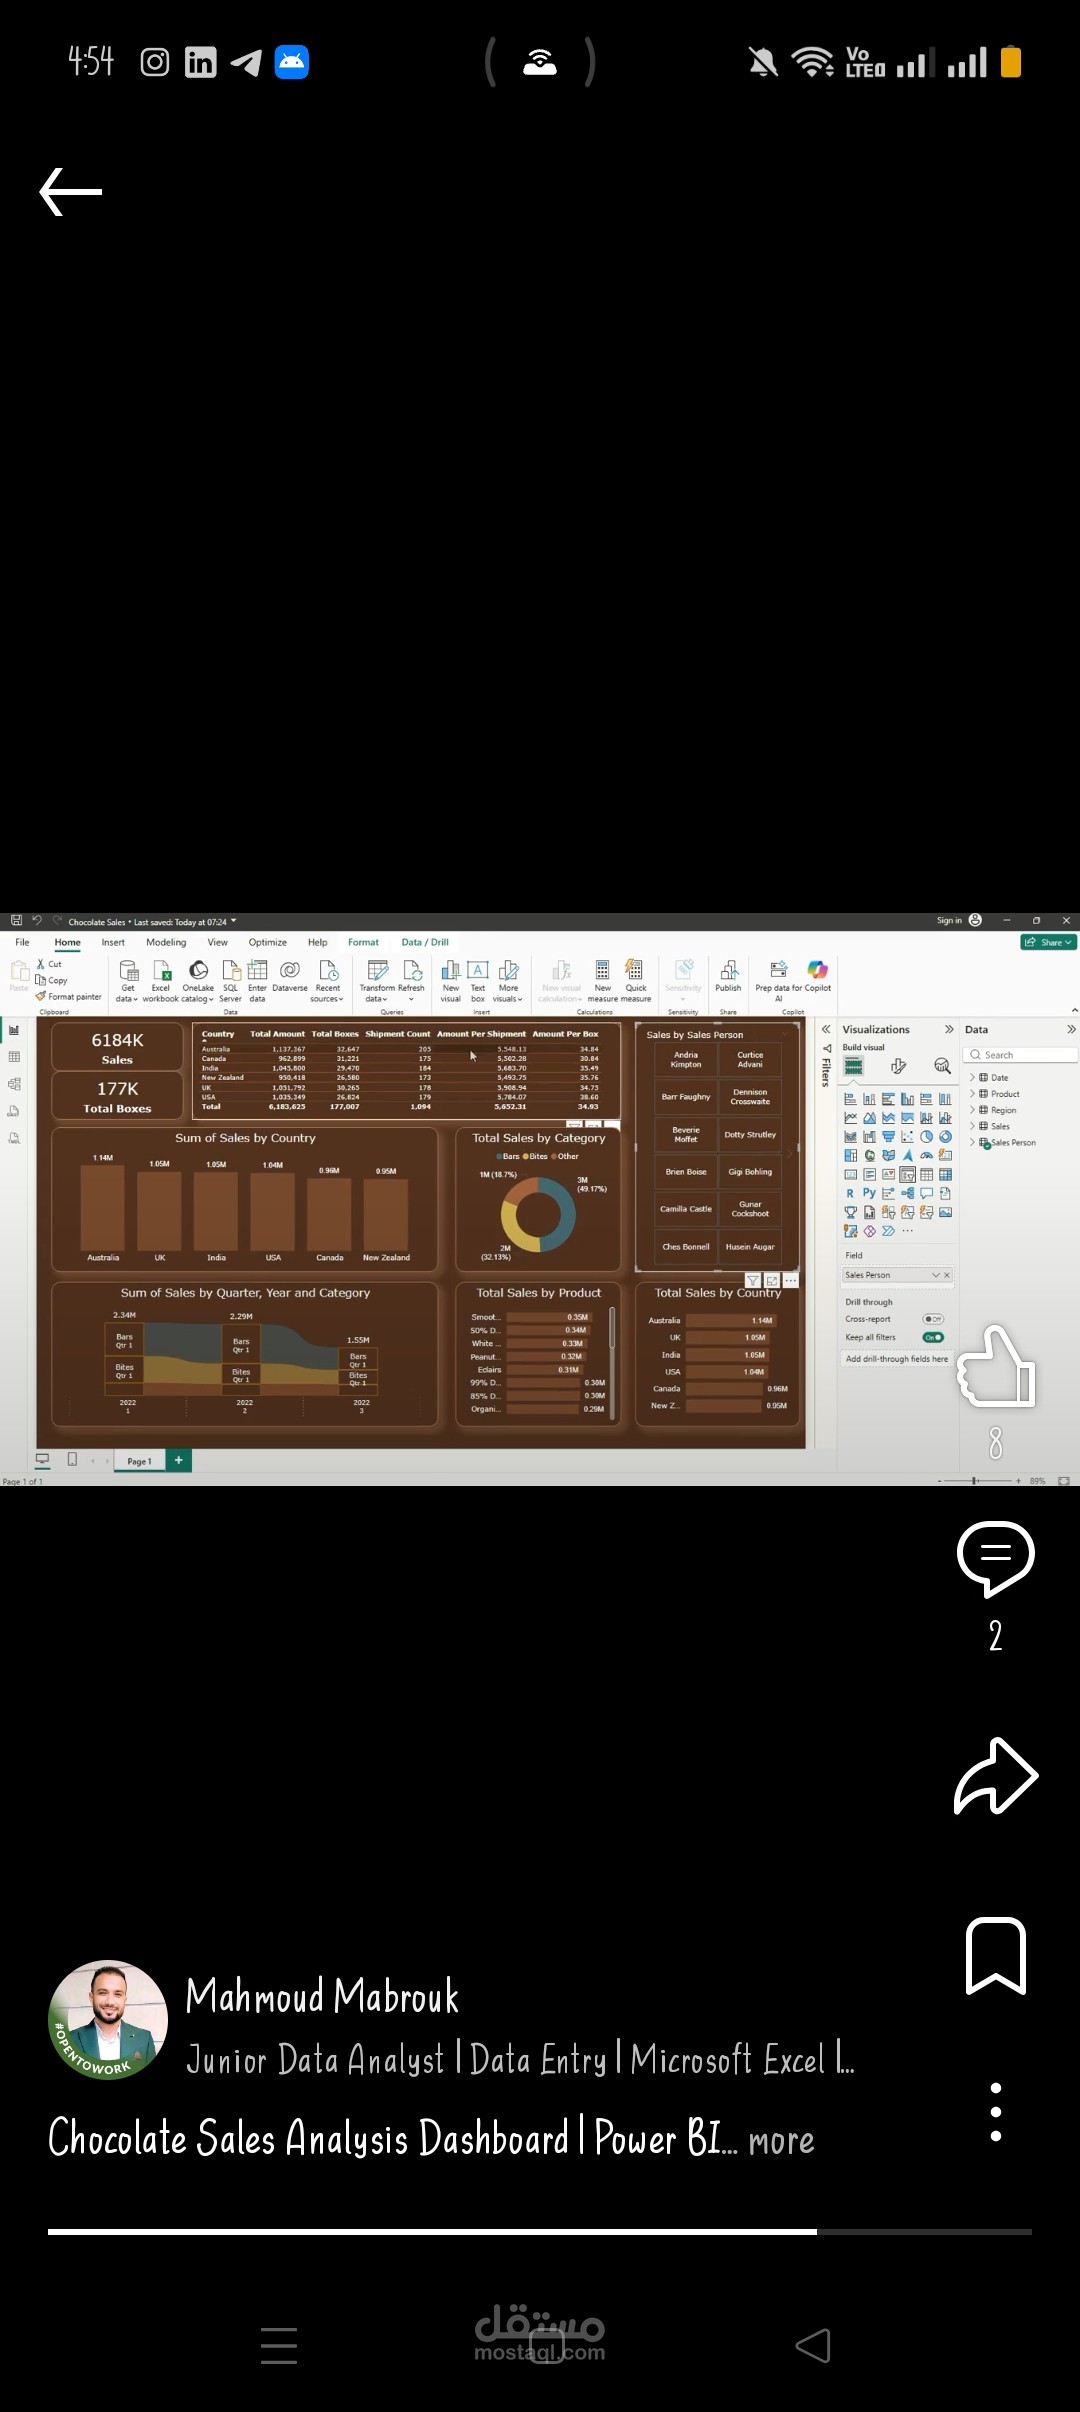
Chocolate Sales Analysis Dashboard | Power BI
I recently created an interactive Chocolate Sales Analysis Dashboard using a publicly available dataset to explore sales performance and shipping trends across different dimensions.
Before building the dashboard, I carefully reviewed, cleaned, and structured the dataset to ensure data accuracy and consistency. This included validating data types, handling inconsistencies, and understanding the relationships between tables to build a reliable data model.
? Key insights covered in this dashboard:
• Total sales and total units shipped
• Salesperson performance
• Quarterly sales trend to track growth
• Boxes shipped by month to understand shipment patterns
• Sales by country for geographic performance comparison
? What I focused on while building this:
• Clear KPI design and business-friendly visual titles
• Interactive slicers for country, product, and year
• Clean layout and consistent theme for easy interpretation
• Turning raw sales data into actionable insights
This project strengthened my skills in Power BI, data modeling, DAX, data cleaning, and data storytelling.