Sales & E-commerce Performance Dashboard | Built with Power BI
تفاصيل العمل
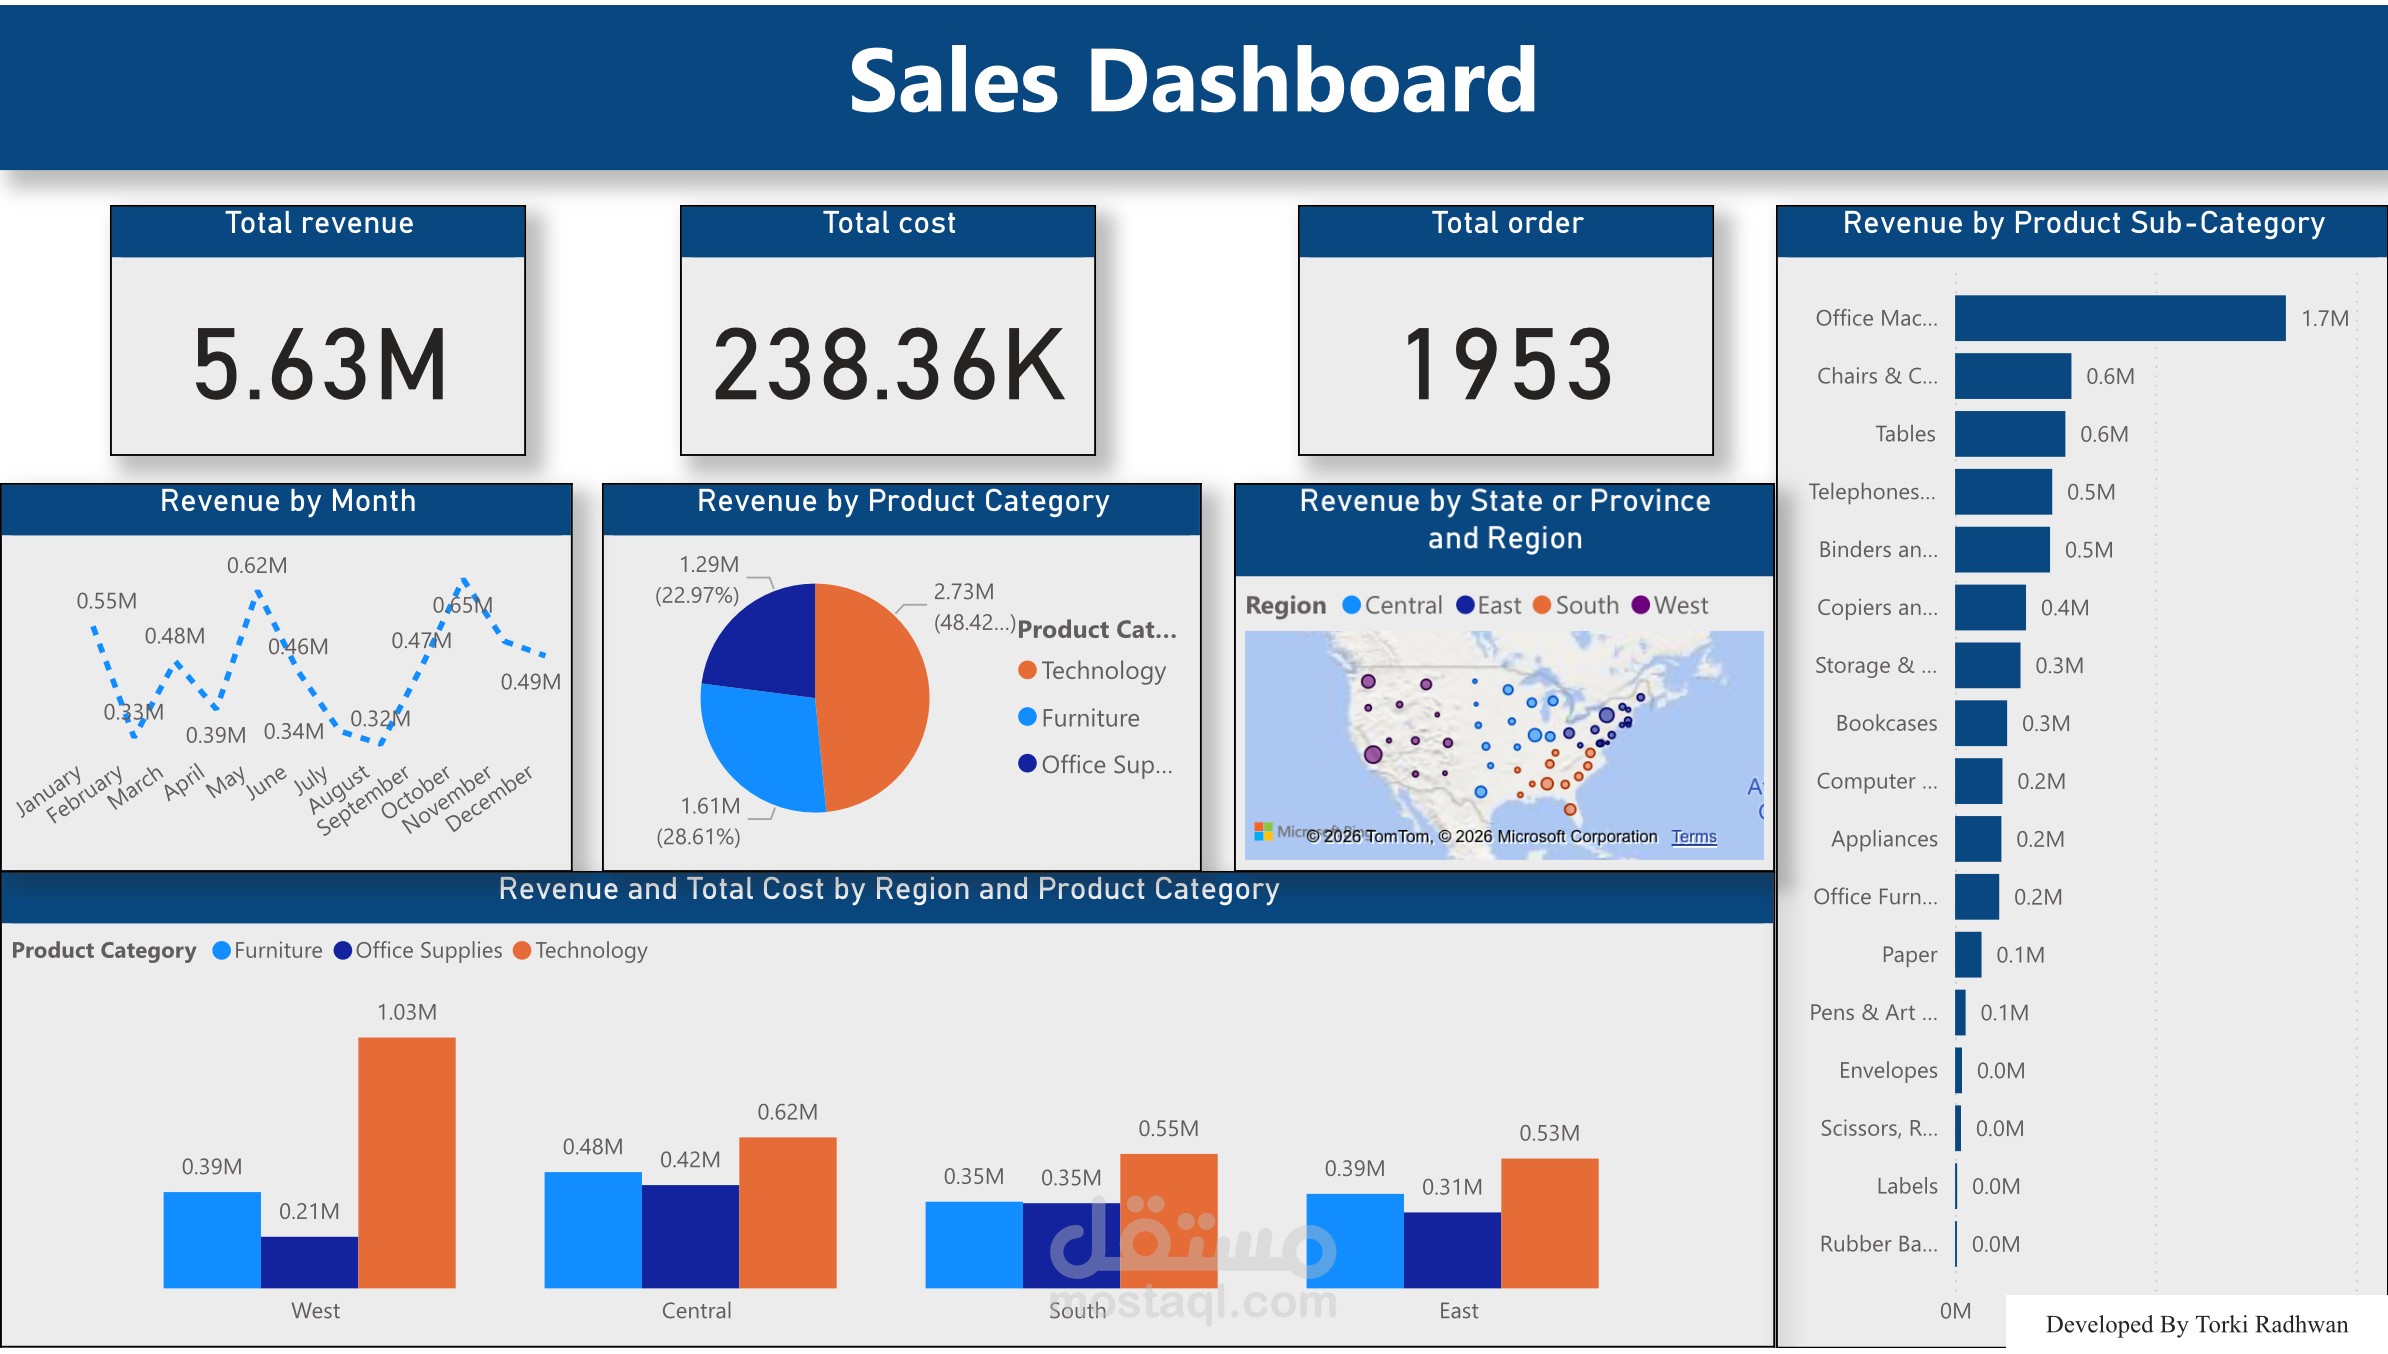
Developed a simple yet impactful dashboard to analyze sales performance across regions, product categories, and time periods. Designed using Power BI’s built-in features, the dashboard provides clear visualizations and actionable insights to support decision-making. Key insights include:
- Total revenue reached $5.63M, with the West region contributing the highest at $1.03M.
- Technology products dominated sales, contributing 48.4% of total revenue.
- Seasonal Trends: October recorded the highest monthly revenue ($0.65M), highlighting opportunities to replicate seasonal success.
- Low total cost ($238.36K) reflects strong profitability and cost management.
- South and East regions showed moderate performance ($0.55M and $0.53M) but hold significant room for expansion.