Sales Dashboard – Power BI Project
تفاصيل العمل

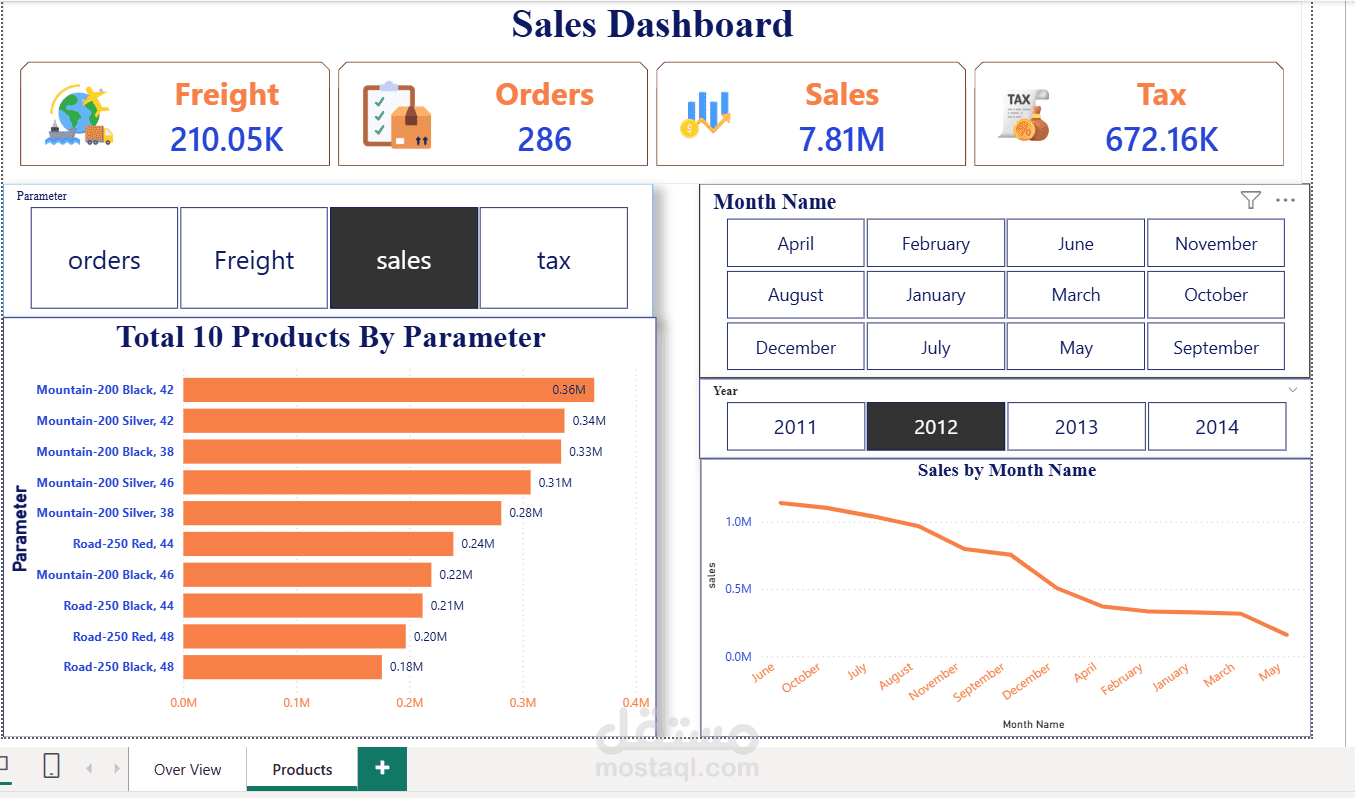
I developed an interactive Sales Dashboard using Power BI to deliver clear insights and support data-driven decisions.
The dashboard highlights:
Total Sales: 7.81M
Total Orders: 286
Total Freight: 210.05K
Total Tax: 672.16K
It includes KPI cards, Top 10 Products analysis (highest at 0.36M), Top 5 Territories (Canada leading with 4.2M), monthly sales trends, and dynamic parameter filtering (Sales, Orders, Freight, Tax).
Built using Power BI, data modeling (Fact & Dimension tables), DAX measures, and interactive slicers to transform raw data into a clear, actionable business insight tool.