Netflix Content Intelligence Dashboard – Power BI
تفاصيل العمل
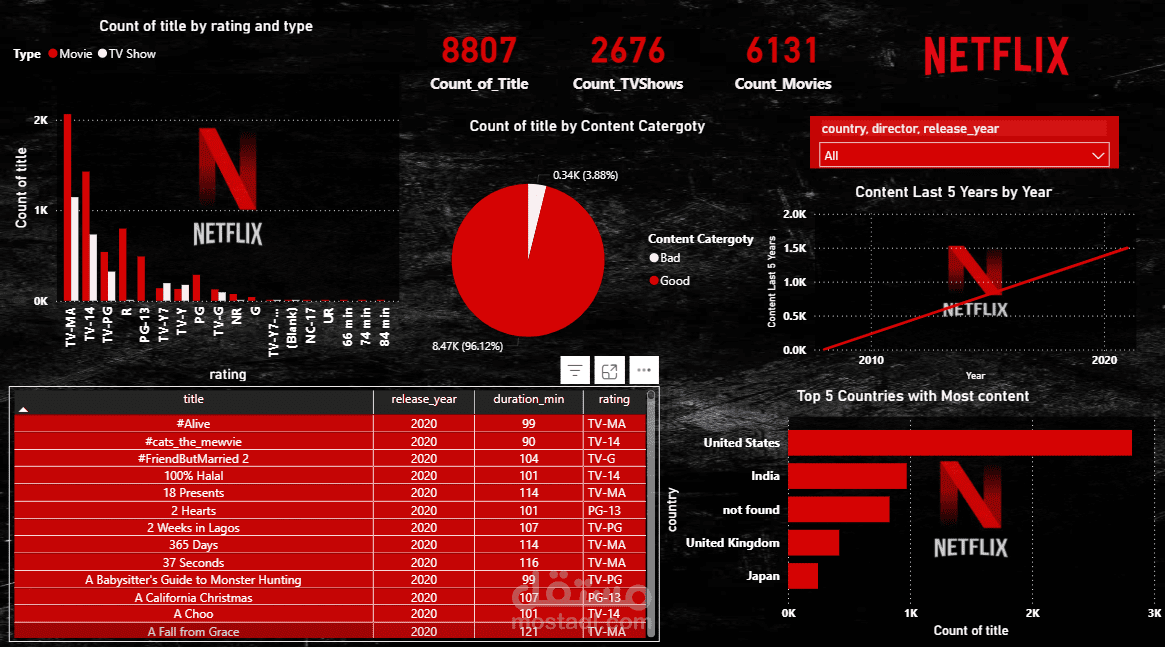

This interactive Power BI dashboard provides a comprehensive analysis of Netflix's global content library, covering 8,807 titles including 6,131 movies and 2,676 TV shows. The dashboard enables users to explore content distribution by rating, type, release year, and country of origin. Key highlights include a rating breakdown bar chart showing TV-MA as the dominant content rating, a content quality classification pie chart revealing that 96.12% of titles are categorized as "Good," and a trend line illustrating steady content growth over the past five years. A geo-analysis section ranks the top 5 content-producing countries, with the United States leading significantly, followed by India, the UK, and Japan. The dashboard also features a dynamic data table displaying individual titles with their release year, duration, and rating, as well as a multi-filter slicer for country, director, and release year. This project demonstrates strong skills in data cleaning, DAX measures, and visual storytelling using Power BI.