Pizza Delicious – Multi-Page Sales Analytics Dashboard – Power BI
تفاصيل العمل
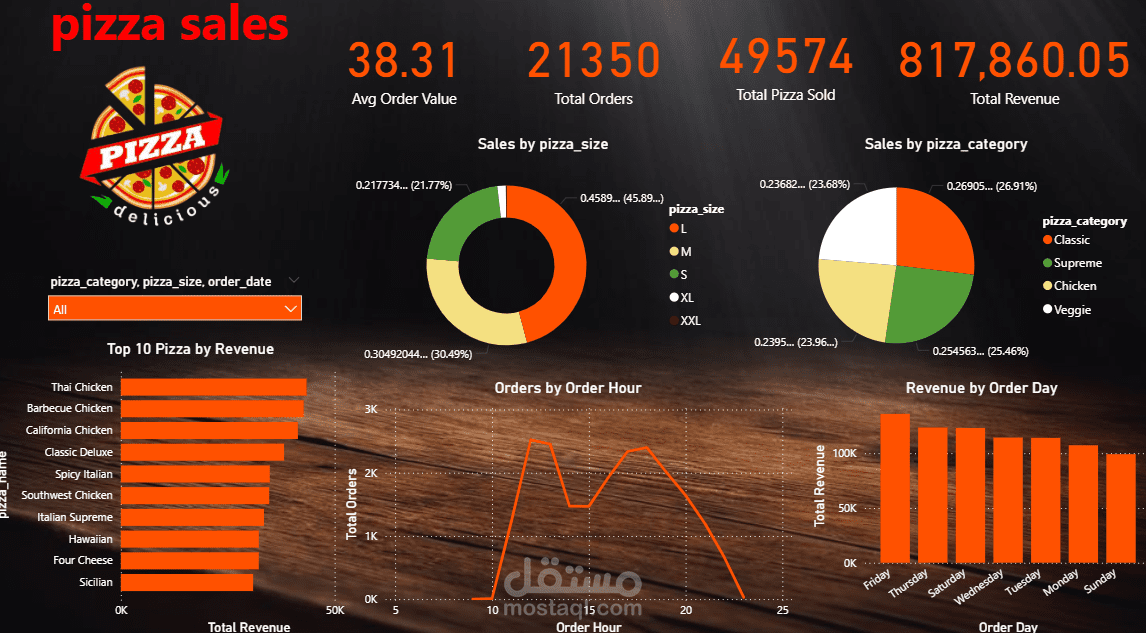


This comprehensive two-page Power BI dashboard delivers a full sales performance analysis for "Pizza Delicious," a pizza restaurant brand. The dashboard is built on a rich dataset covering 49,574 total pizzas sold, 21,350 total orders, a total revenue of 817,860.05, and an average order value of 38.31, providing a complete picture of the restaurant's business performance.
Page 1 – Overall Sales Overview:
The first page presents a high-level summary of the entire sales period. A donut chart breaks down sales by pizza size, revealing that Large (L) is the dominant size at 45.89%, followed by Medium at 30.49% and Small at 21.77%. A pie chart visualizes sales by pizza category, with Supreme leading at 26.91%, followed by Chicken at 25.46%, Veggie at 23.96%, and Classic at 23.68%. A horizontal bar chart ranks the Top 10 pizzas by revenue, with Thai Chicken, Barbecue Chicken, and California Chicken leading the list. An "Orders by Order Hour" line chart identifies peak ordering times between hours 12 and 21, with the busiest period around midday and early evening. A "Revenue by Order Day" bar chart shows Friday as the highest-revenue day, followed by Thursday and Saturday, helping the business plan staffing and promotions more effectively. Dynamic slicers for pizza category, pizza size, and order date allow full interactivity across the page.
Page 2 – Monthly Deep Dive (February):
The second page focuses specifically on February performance, recording 3,961 pizzas sold. It features dual donut charts comparing percentage sales and revenue by pizza category side by side, confirming consistent category performance. A top 5 best sellers bar chart highlights Classic Deluxe, Barbecue Chicken, Hawaiian, Pepperoni, and Thai Chicken as the strongest performers by quantity. A bottom 5 sellers chart flags Soppressata, Spinach Supreme, Calabrese, Mediterranean, and Brie Carre as the lowest-selling items, providing actionable insight for menu optimization. A revenue by pizza size donut chart shows Large generating 375.32K in revenue, reinforcing its dominance. Slicers for order quarter, month, and day allow granular time-based filtering throughout the page.