تحليل البيانات وإنشاء تقارير ولوحات معلومات باستخدام Power BI لدعم اتخاذ القرار.
تفاصيل العمل
لقد قمت بعمل تنظيف للداتا عليPower Query قبل البدء في تنفيذ التحليل ثم بعد ذلك استخدمت Power BI بعد ان قمت بتنظيف الداتا وكان قد طلب العميل التالي :
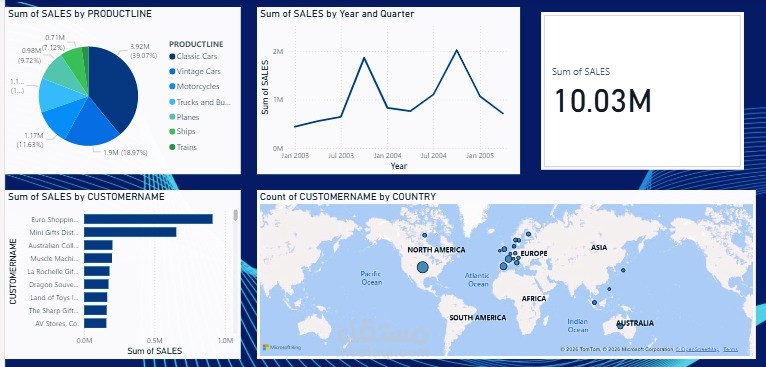
1-Creat line chart to visualize total sales over time
2-Creat a map visualization to see distribution of customers by country
3-Creat a ranked bar chart or a table showing the top customers by total sales
4-Creat a bar or pie chart to compare sales across different product lines
5-Creat a stacked bar chart to show quarterly sales and compare it across years
6-Creat a scatter plot to compare MSRP and SALES by product line