Multiple-Linear-Regression-Model
تفاصيل العمل
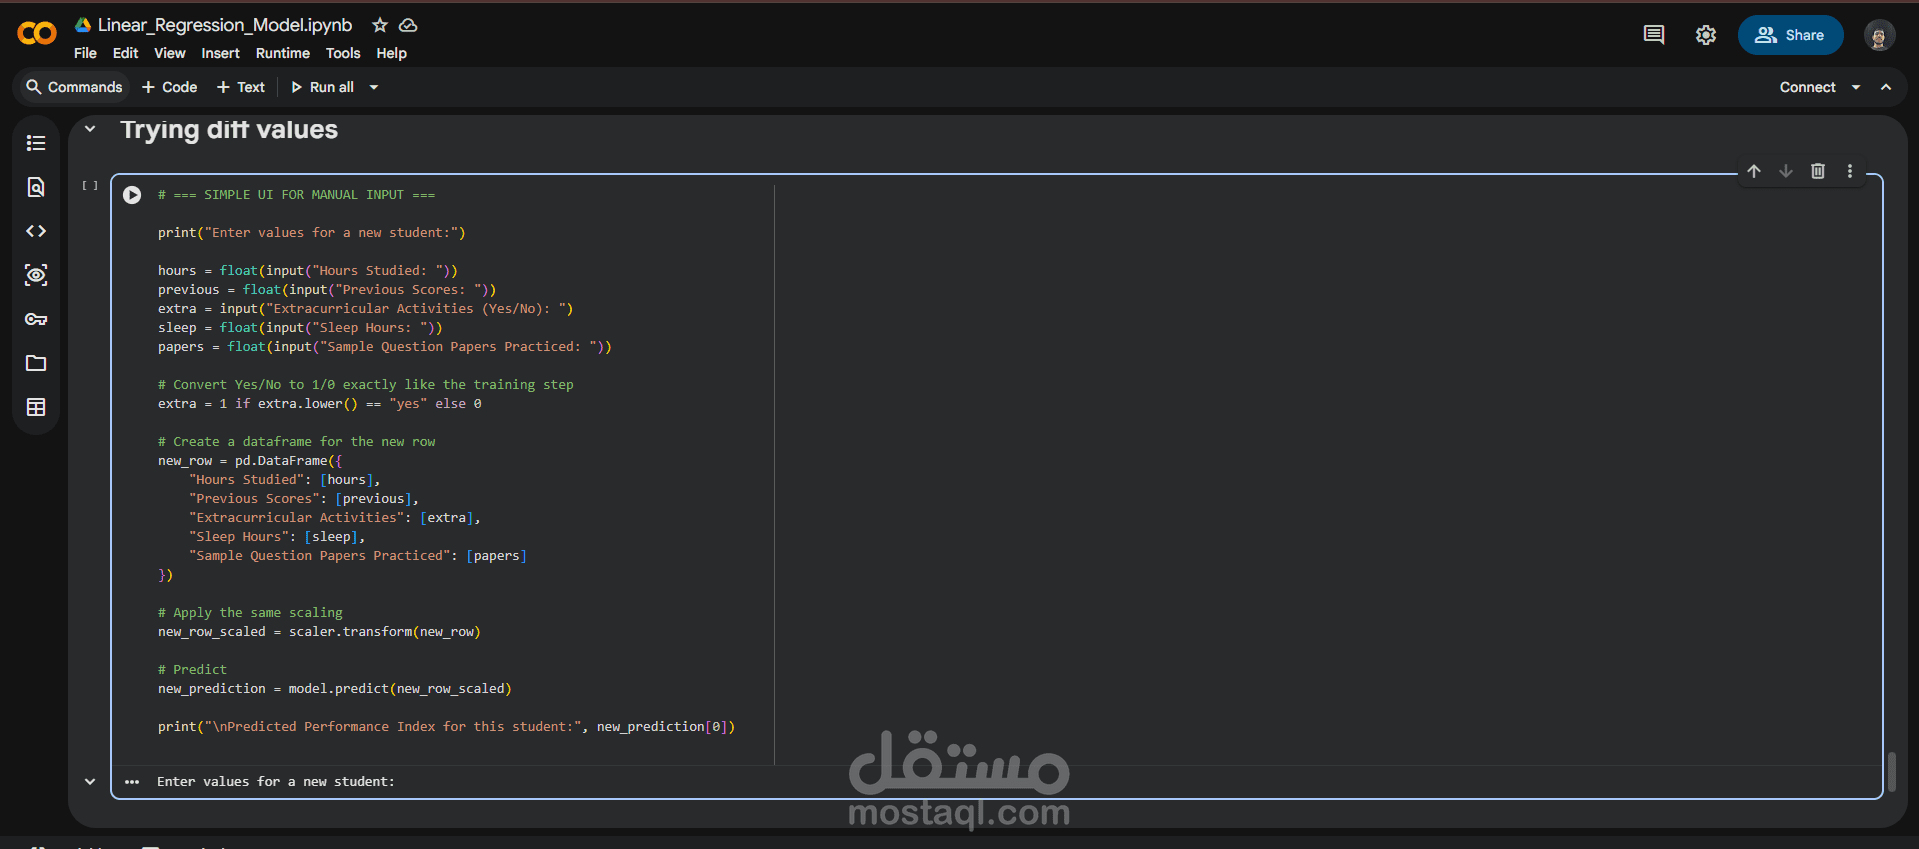
? Student Performance Prediction using Linear Regression
This project focuses on analyzing and predicting students’ Performance Index using a Linear Regression model. The workflow follows a complete data science pipeline, starting from data cleaning and preprocessing to model training, evaluation, and visualization.
? Dataset
File name: Student_Performance_missing.csv
Target variable: Performance Index
Features include:
Hours Studied
Previous Scores
Sleep Hours
Sample Question Papers Practiced
Extracurricular Activities (Yes / No)
?️ Libraries Used
pandas
numpy
matplotlib
seaborn
scikit-learn
? Project Workflow
1️⃣ Data Loading
Load dataset using pandas
Display first rows
Check dataset shape
2️⃣ Data Inspection
Check value distribution of Performance Index
Detect duplicate rows
Remove duplicates
Generate statistical summary using describe()
Inspect data types and missing values using info()
3️⃣ Missing Values Analysis
Identify columns with missing values
Calculate:
Total missing values
Percentage of missing values
Identify numerical vs categorical columns
4️⃣ Missing Values Imputation
Numerical columns: Imputed using Mean
Categorical column: Imputed using Most Frequent value
Numerical Imputer → Mean
Categorical Imputer → Mode
5️⃣ Encoding
Binary encoding for Extracurricular Activities
Yes → 1
No → 0
Separate:
Features (X)
Target (y)
6️⃣ Train–Test Split
70% Training data
30% Testing data
random_state = 42 for reproducibility
7️⃣ Exploratory Visualization
Scatter plots between each feature and Performance Index
Helps understand relationships between variables
8️⃣ Feature Scaling
Apply StandardScaler
Scaling is done after train-test split
Prevents data leakage
9️⃣ Model Training
Model used: Linear Regression
Train model on scaled training data
Extract:
Coefficients
Intercept
? Model Evaluation
The model is evaluated using:
MAE (Mean Absolute Error)
RMSE (Root Mean Squared Error)
R² Score
These metrics measure prediction accuracy and model fit.
? Visualization of Results
Scatter plot:
Actual vs Predicted Performance Index
Reference line for perfect prediction
Clear visualization of model performance
? Prediction Table
A final table is created containing:
Original row index
Actual Performance Index
Predicted Performance Index
Useful for comparison and analysis.
✅ Key Takeaways
Proper data cleaning significantly improves model performance
Feature scaling is essential for regression models
Linear Regression provides interpretable results through coefficients
Visualization helps validate model predictions
? Future Improvements
Try advanced models (Ridge, Lasso, Random Forest)
Add cross-validation
Feature importance analysis
Hyperparameter tuning
Deploy as a web app (Streamlit / Flask)
?? Author
Student Performance Prediction Project Built for learning and academic purposes in Data Science & Machine Learning.