Dashboard call center analysis
تفاصيل العمل
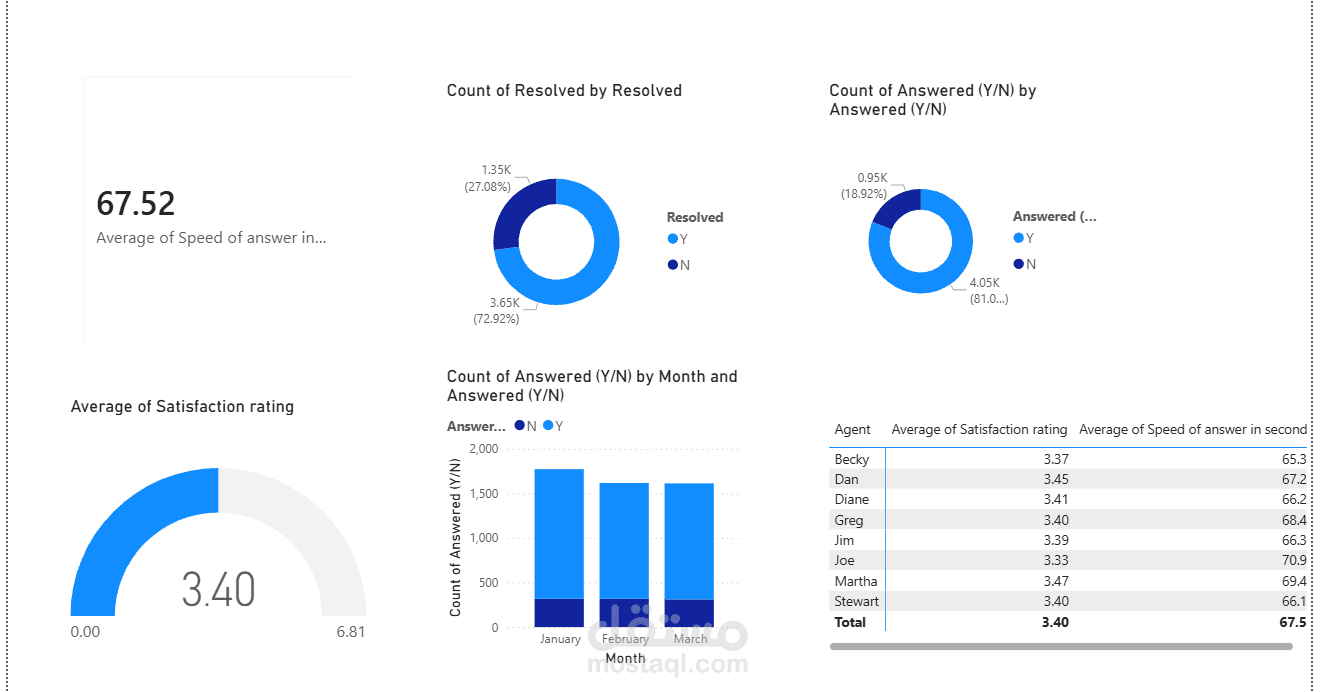
Developed an interactive Call Center Dashboard using Power BI to monitor and analyze key performance indicators (KPIs) related to customer service operations. The dashboard provides insights into call volume, agent performance, response times, customer satisfaction, and operational efficiency.
Key features include real-time visualization of incoming and outgoing calls, average handling time, resolution rates, and agent productivity. Implemented dynamic filters and slicers to allow users to analyze performance by agent, date, call type, and department.
The dashboard helps management identify performance trends, optimize resource allocation, improve response times, and enhance overall customer experience. Data was transformed and modeled using Power Query and DAX to ensure accuracy and meaningful analysis.
Tools Used: Power BI, Power Query, DAX, Data Modeling, Data Visualization