resturant
تفاصيل العمل
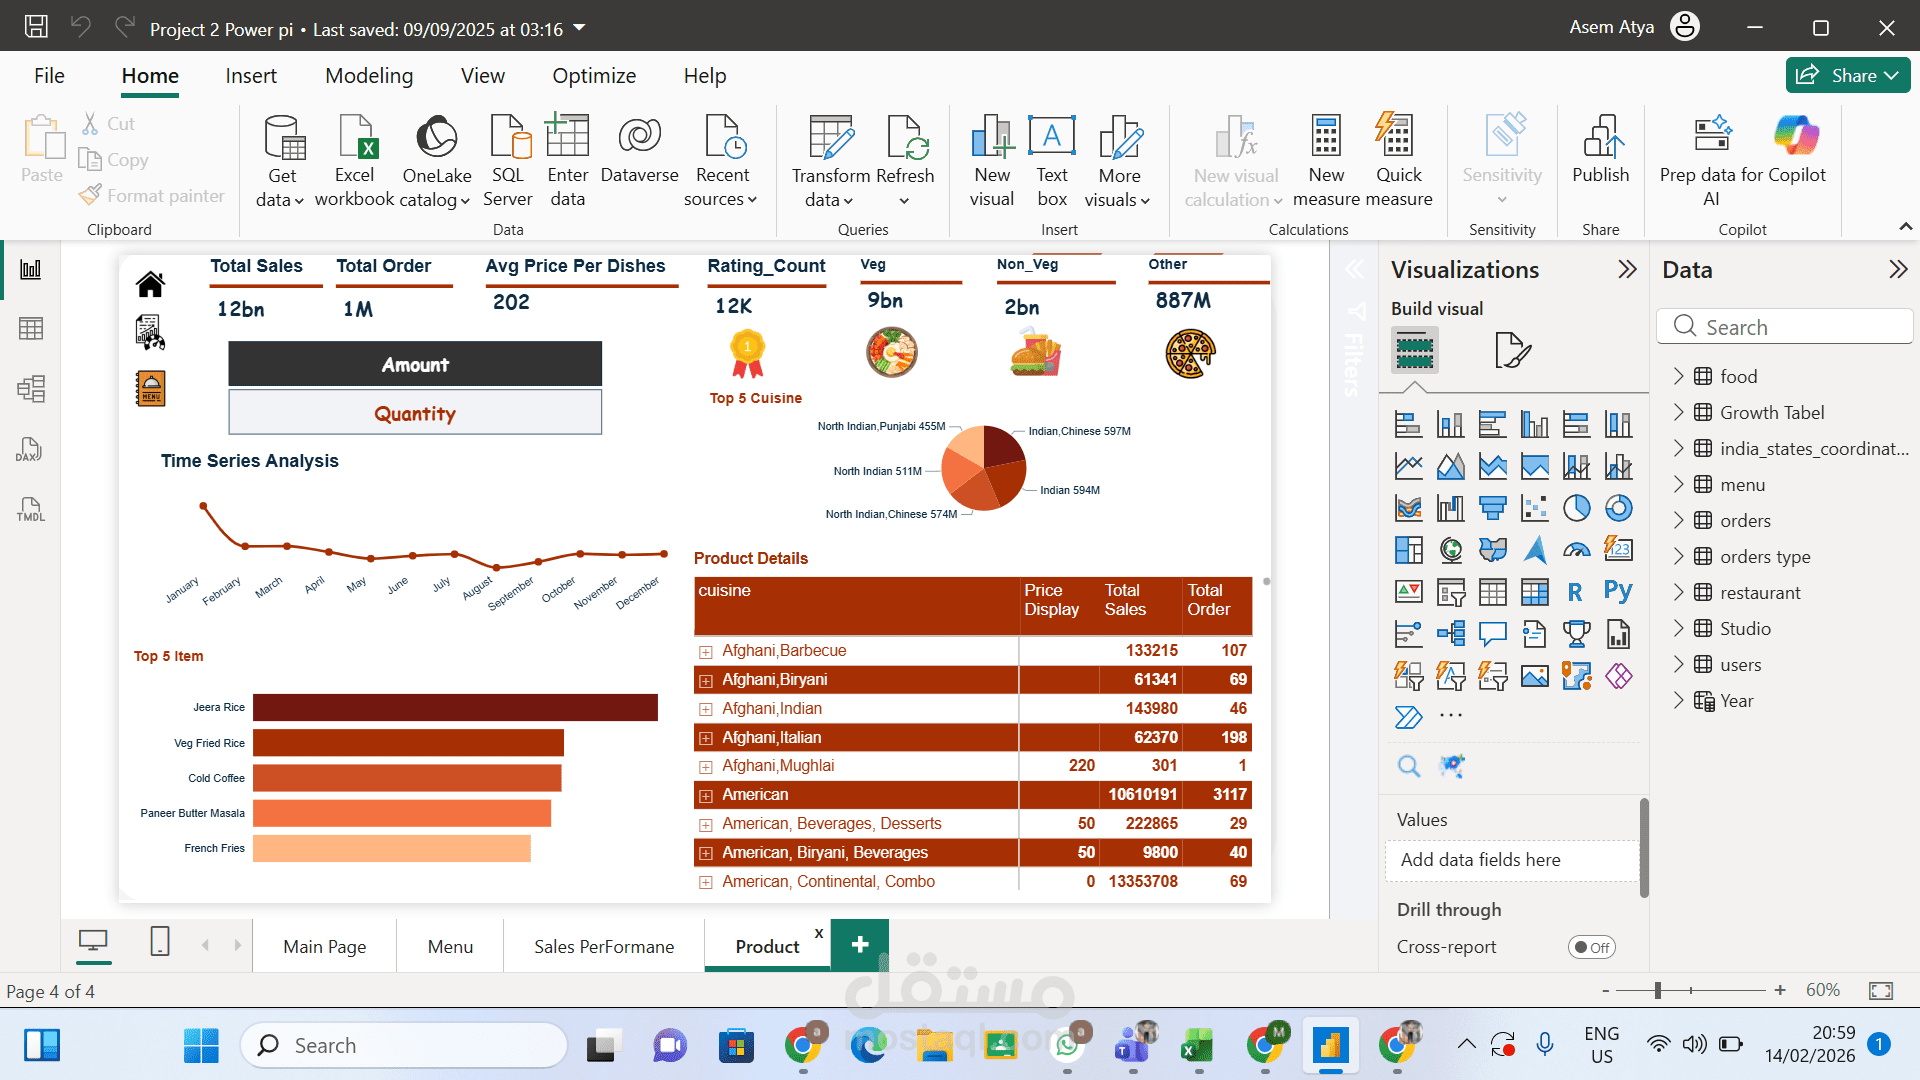
I’ve just completed a Power BI project for restaurants in India, analyzing different food categories such as pizza, burgers, vegetarian, and non-vegetarian dishes.
? Using DAX, I measured year-over-year growth, identified active vs. inactive customers, and built interactive dashboards with a unified design.
✨ Highlights:
• Sales page: Top sellers, Top 5 cities & restaurants, and regional sales map.
• Product page: Best-selling dishes, category insights, and total sales overview.
• Main dashboard linking all insights together.
This project helped me transform raw data into clear business insights.
hashtag#PowerBI hashtag#DataAnalytics hashtag#BusinessIntelligence hashtag#DataVisualization hashtag#DashboardDesign hashtag#DAX hashtag#RestaurantAnalytics hashtag#FoodIndustry hashtag#India