تحليل بيانات لتجاره الكترونيه
تفاصيل العمل
تحليل ? Sales, Customer & Product Performance Dashboard | Power BI
I’m excited to share my latest Power BI Dashboard, designed to provide a complete and interactive view of business performance across Sales, Customers, and Products.
? Sales Analytics
Total Sales, Orders, and Profit KPIs
Monthly and yearly sales trends
Time-based analysis using Year/Month slicers
? Customer Insights
Total customers overview
Customer growth and behavior analysis
Identification of repeat and new customers
Better understanding of customer engagement
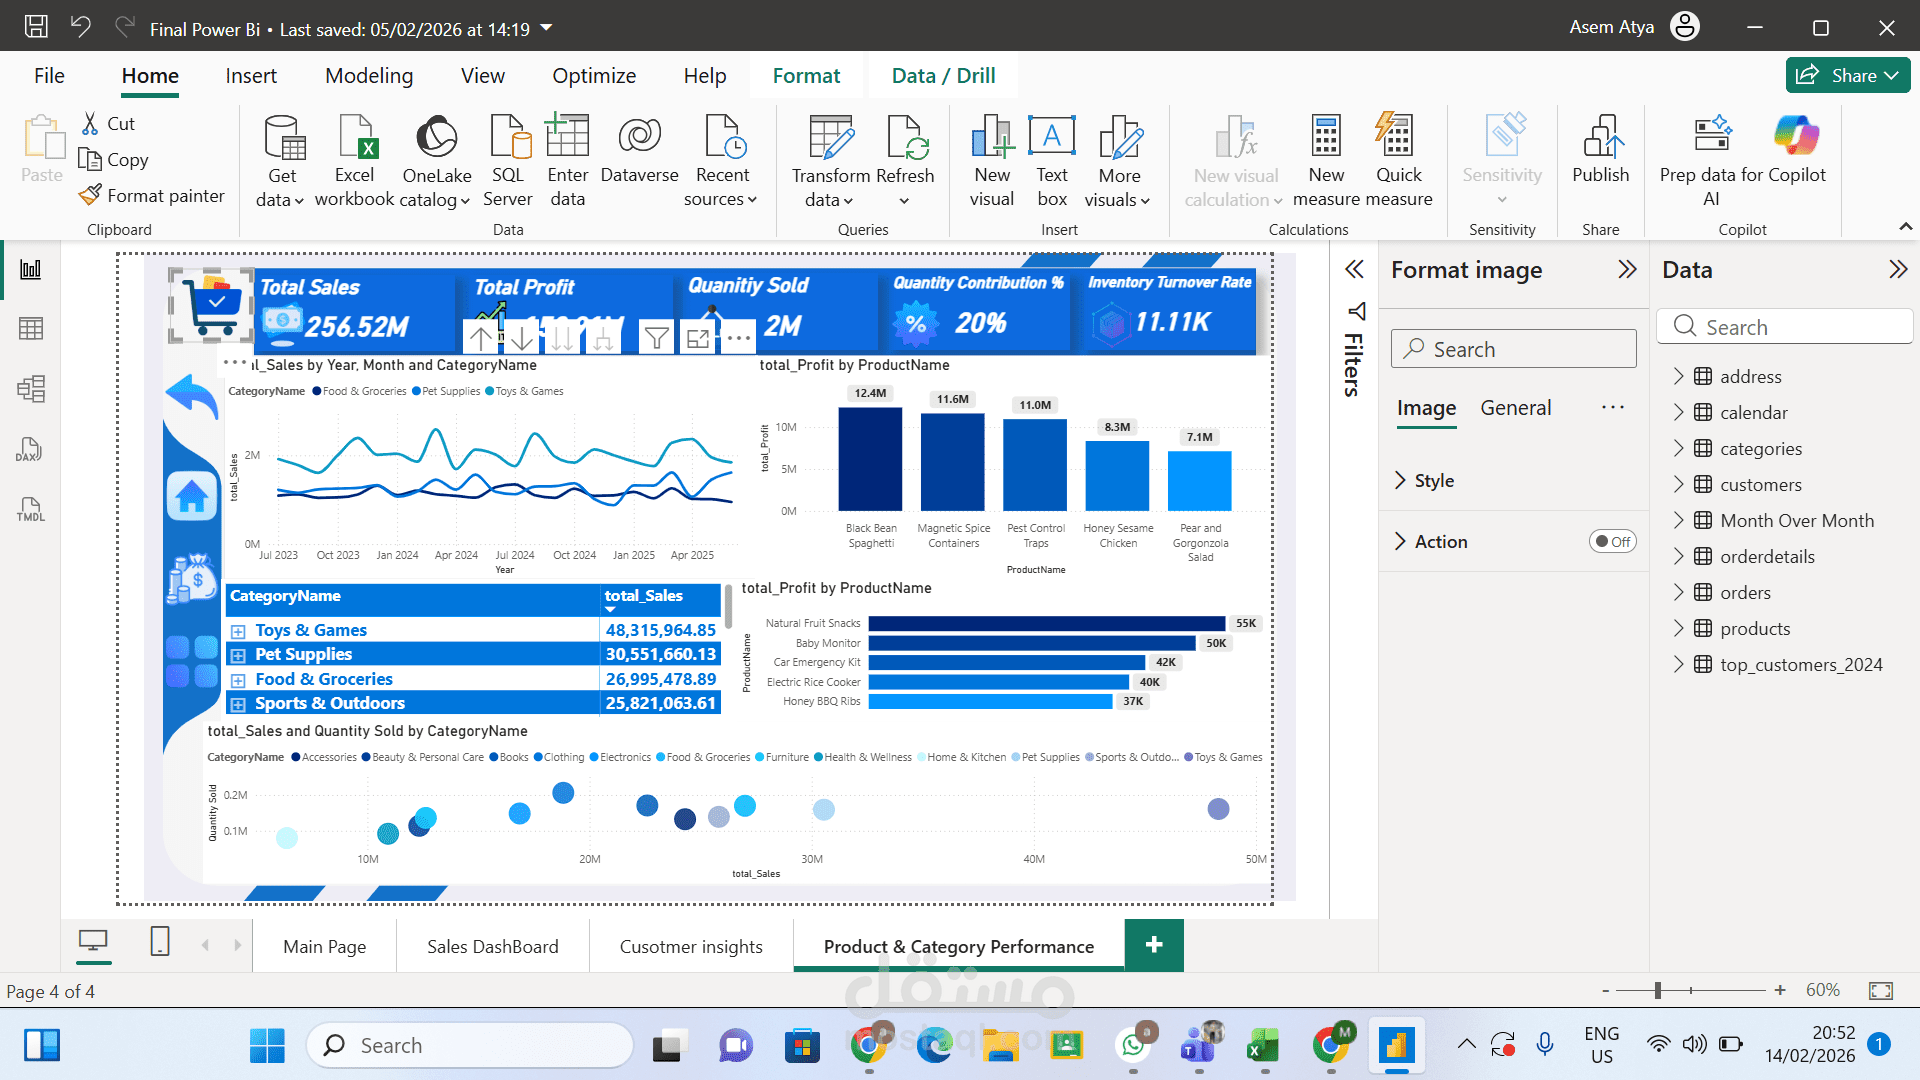
? Product & Category Performance
Product and category performance over time
Identification of top and underperforming products
Category-level contribution to overall sales
✨ Key Features
Interactive navigation between pages
Dynamic KPIs responding to filters
Drill-through for detailed analysis
Clean and business-focused dashboard design
? Tools & Skills Used
Power BI Desktop
DAX for advanced calculations
SQL for data preparation and modeling
This dashboard is built to support data-driven decision making, helping stakeholders quickly identify trends, opportunities, and performance gaps.
? Feedback is always welcome!
hashtag#PowerBI hashtag#DataAnalytics hashtag#BusinessIntelligence hashtag#SalesAnalytics
hashtag#CustomerInsights hashtag#ProductAnalytics hashtag#DashboardDesign hashtag#SQL hashtag#DAX