Doctors & Specialties Insights
تفاصيل العمل
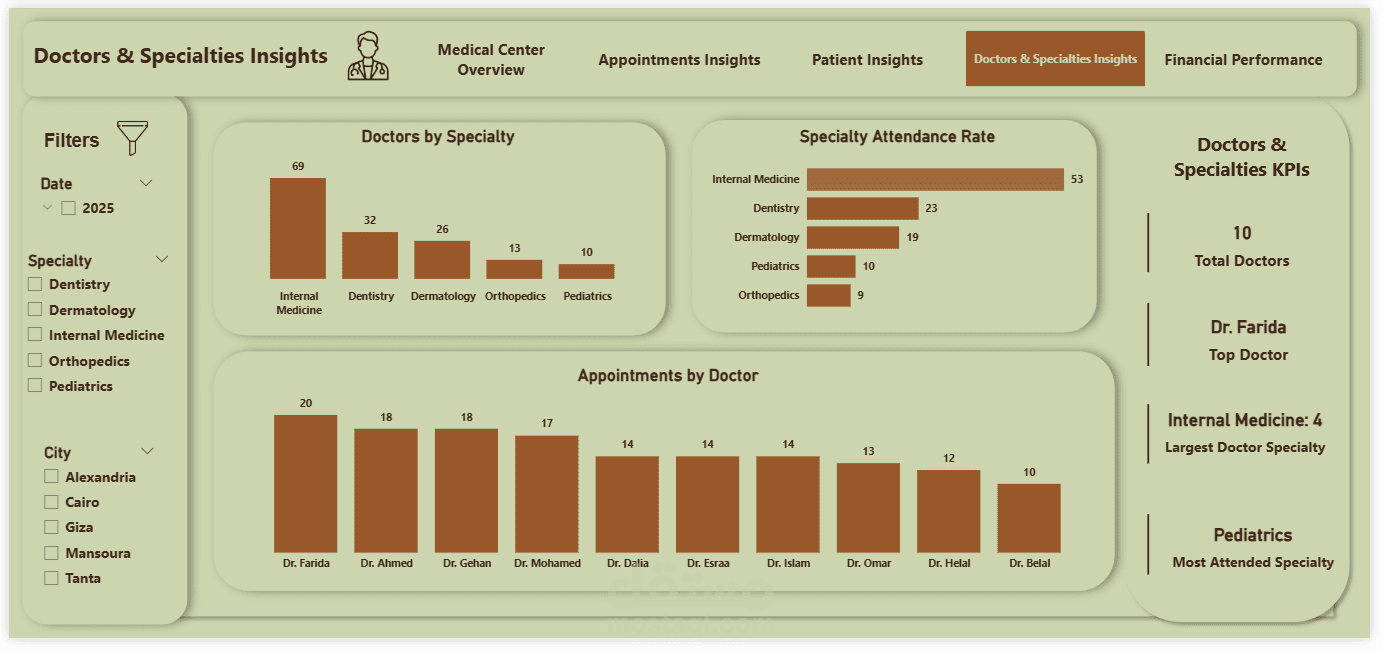
This project focuses on transforming doctors and appointments data into a clear, visual, and actionable overview to help medical centers evaluate doctors’ performance, understand specialty distribution, and optimize appointment management.
Key Highlights of the Dashboard:
• Comprehensive Doctors KPIs: Total Doctors, Top Doctor by Appointments, Average Appointments per Doctor
• Doctors Performance Analysis: Number of appointments per doctor and identification of busy doctors
• Specialties Distribution Analysis: Doctors count by specialty and comparison across different specialties
• Appointments Insights: Number of appointments per specialty and analysis of appointment volume by specialty
• Attendance & Engagement Analysis: Identification of the most attended specialty based on show rate
• Smart Filtering Capabilities: Easily filter data by year, specialty, and city for focused and targeted insights
Tools & Techniques:
hashtag#DataAnalysis hashtag#DataVisualization hashtag#KPIs hashtag#DashboardDesign hashtag#HealthcareAnalytics hashtag#InteractiveDashboard