Patient Insights
تفاصيل العمل
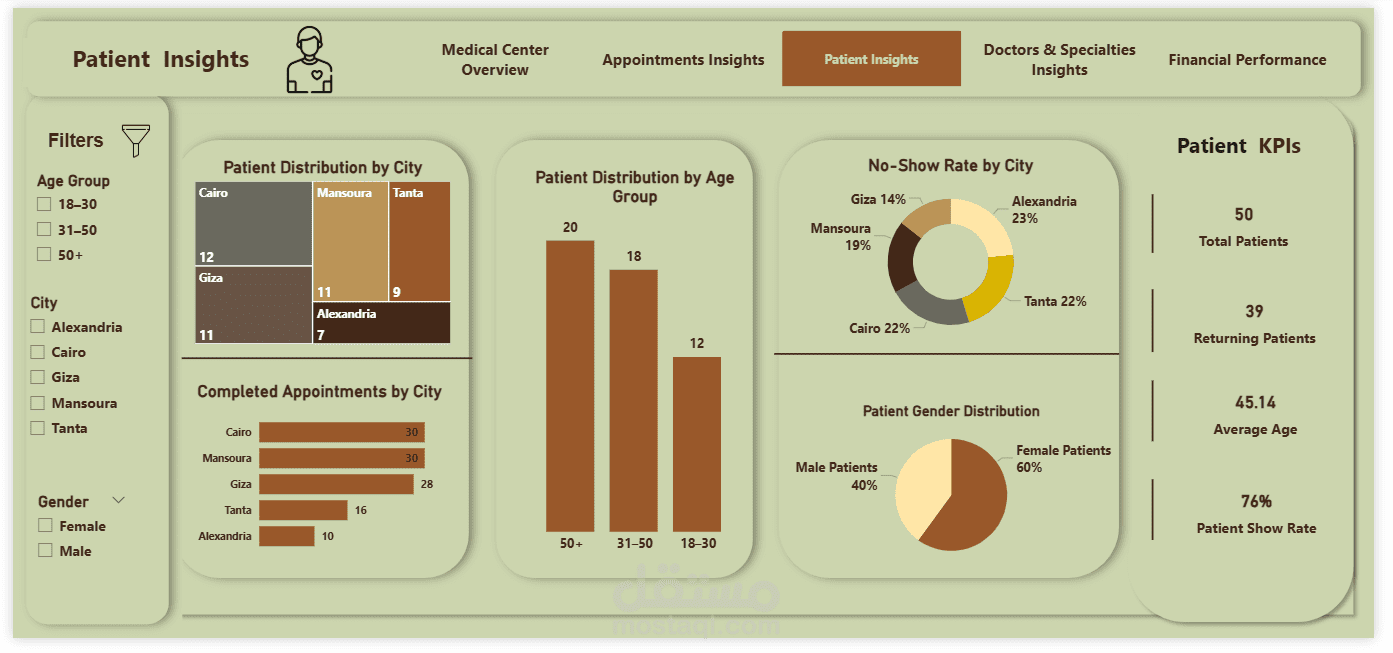

This project focuses on transforming patient and appointment data into a clear, visual, and actionable overview to help medical centers understand patient behavior and improve service delivery.
Key Highlights of the Dashboard:
• Comprehensive Patient KPIs: Total Patients, Returning Patients, Average Age, Patient Show Rate
• Patient Distribution Analysis: By City and Age Group
• Gender Distribution: Visual comparison between male and female patients
• Appointments Insights: Number of completed appointments per city, appointments per patient
• No-Show Analysis: City-wise no-show rates to identify patterns and improve scheduling
• Filter Functionality: Easily filter data by age group, city, and gender for targeted insights
Tools & Techniques:
hashtag#DataAnalysis hashtag#DataVisualization hashtag#KPIs hashtag#DashboardDesign hashtag#PatientInsights hashtag#InteractiveDashboard