HR Analytics Dashboard .
تفاصيل العمل
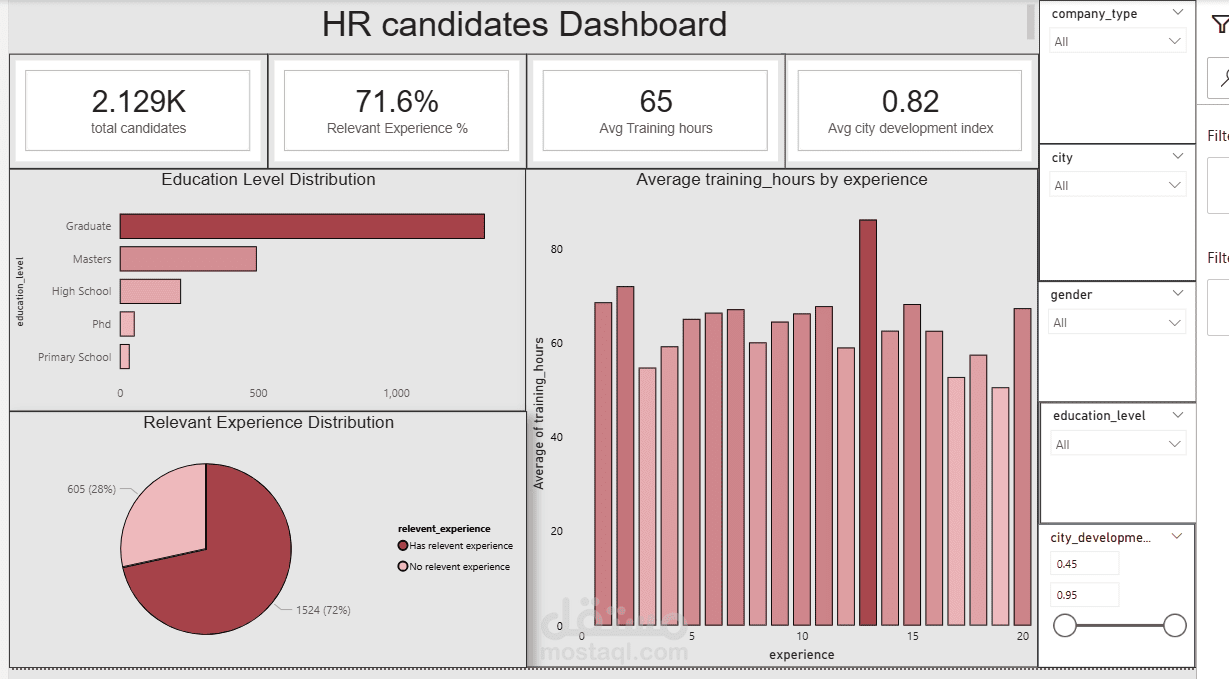

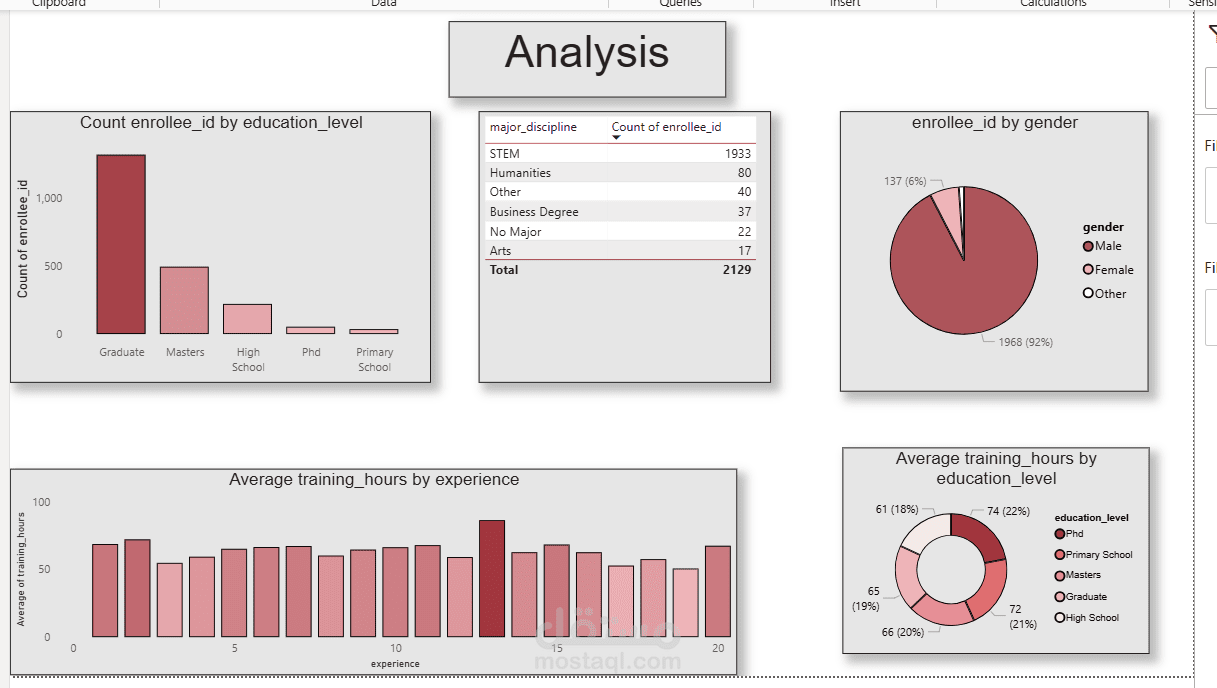
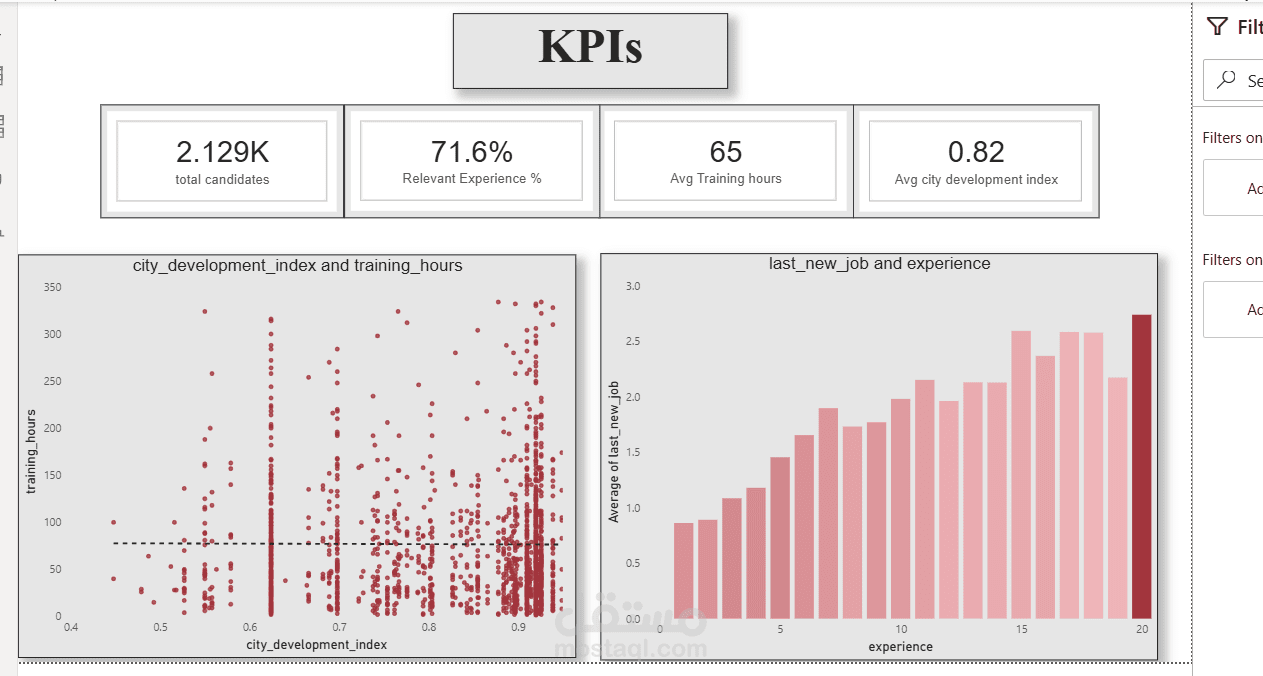
Built an interactive dashboard using Power BI to visualize and analyze workforce data.
-Provided insights into employee distribution, gender diversity, attrition trends, and
department-wise analysis.
-Used Power Query for data preparation and DAX to create custom KPIs.
-Designed dynamic visuals and slicers to enable effective filtering and storytelling.