Dashboard PowerBi
تفاصيل العمل
? Power BI Dashboard | Sales & Data Analysis Project
I designed an interactive Power BI dashboard to analyze sales performance and business indicators, transforming raw data into clear and actionable insights.
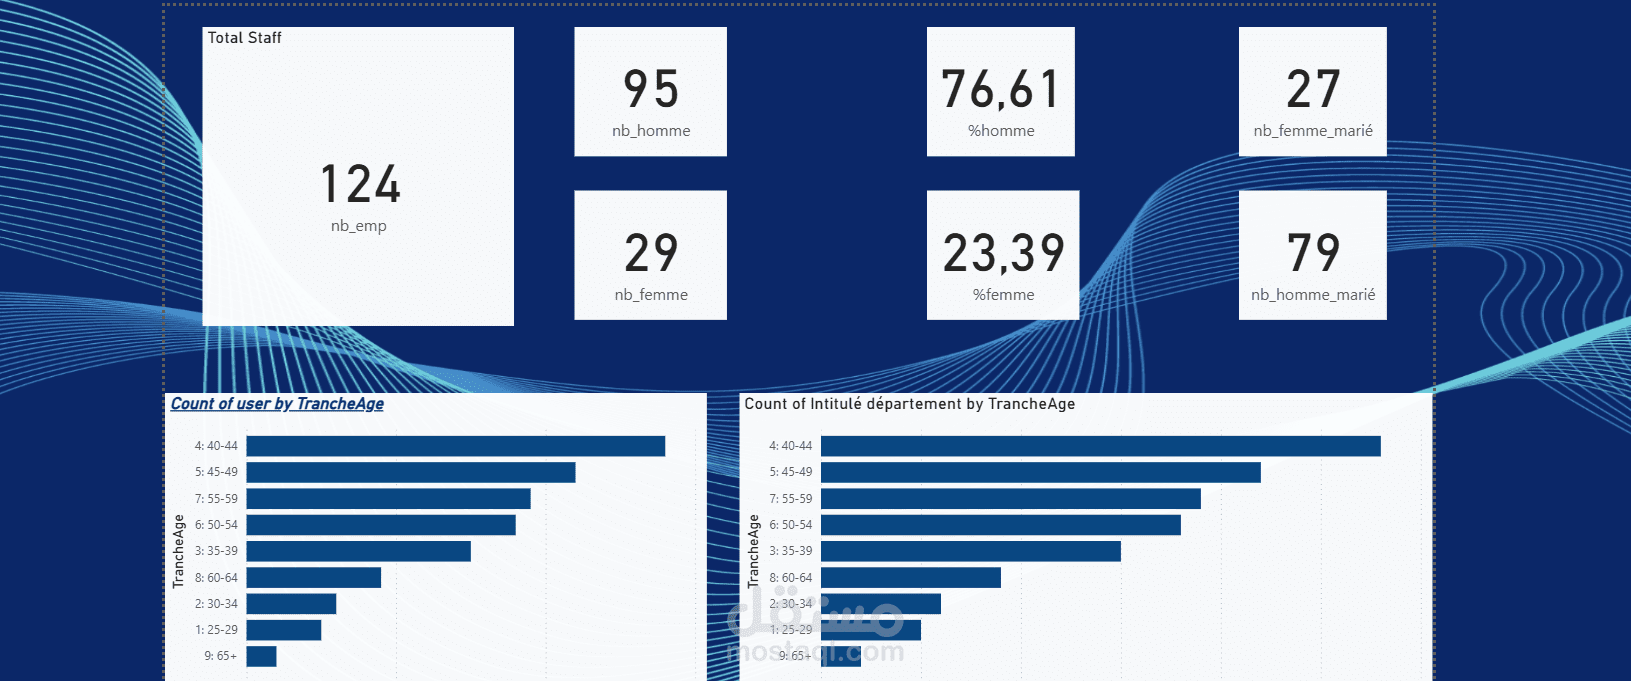
This dashboard provides:
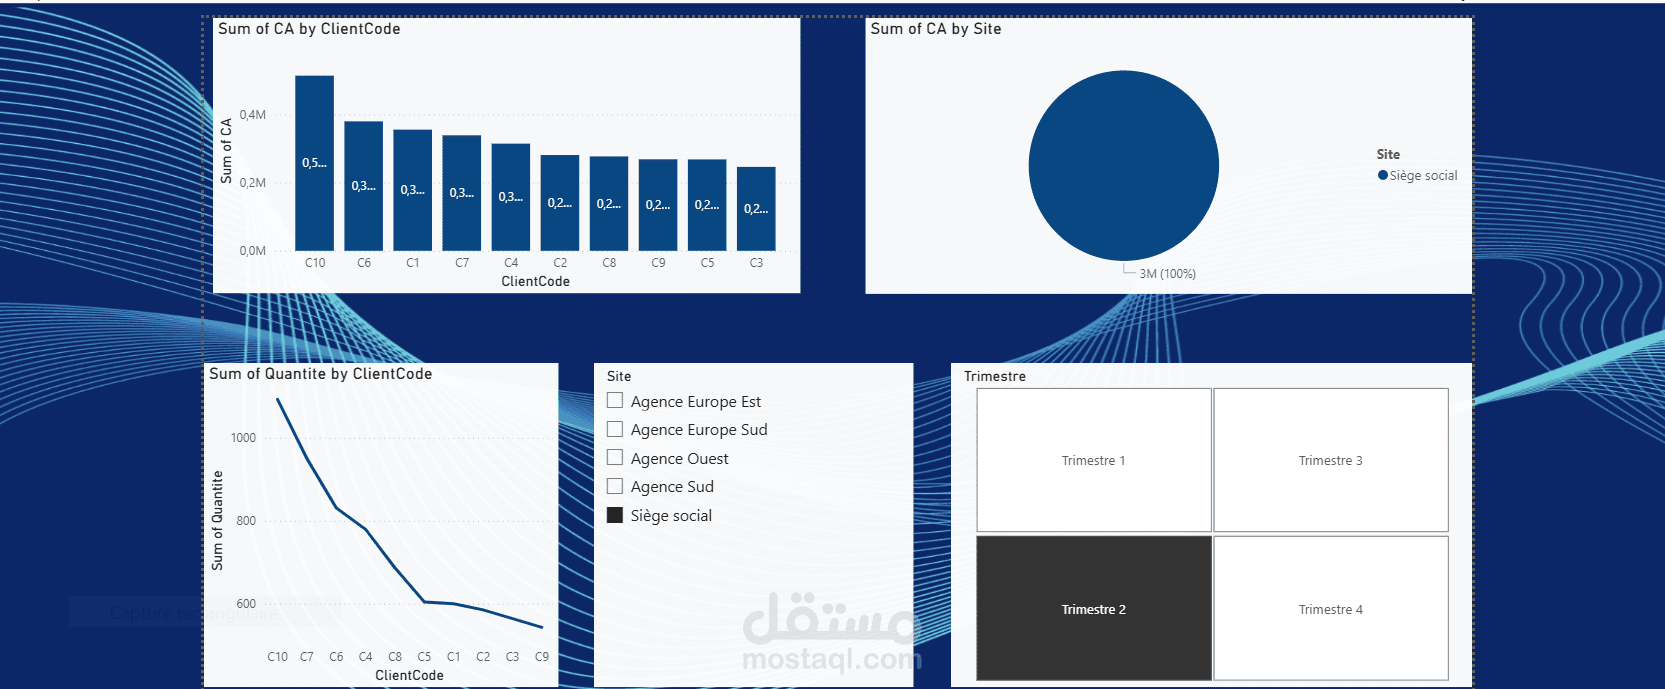
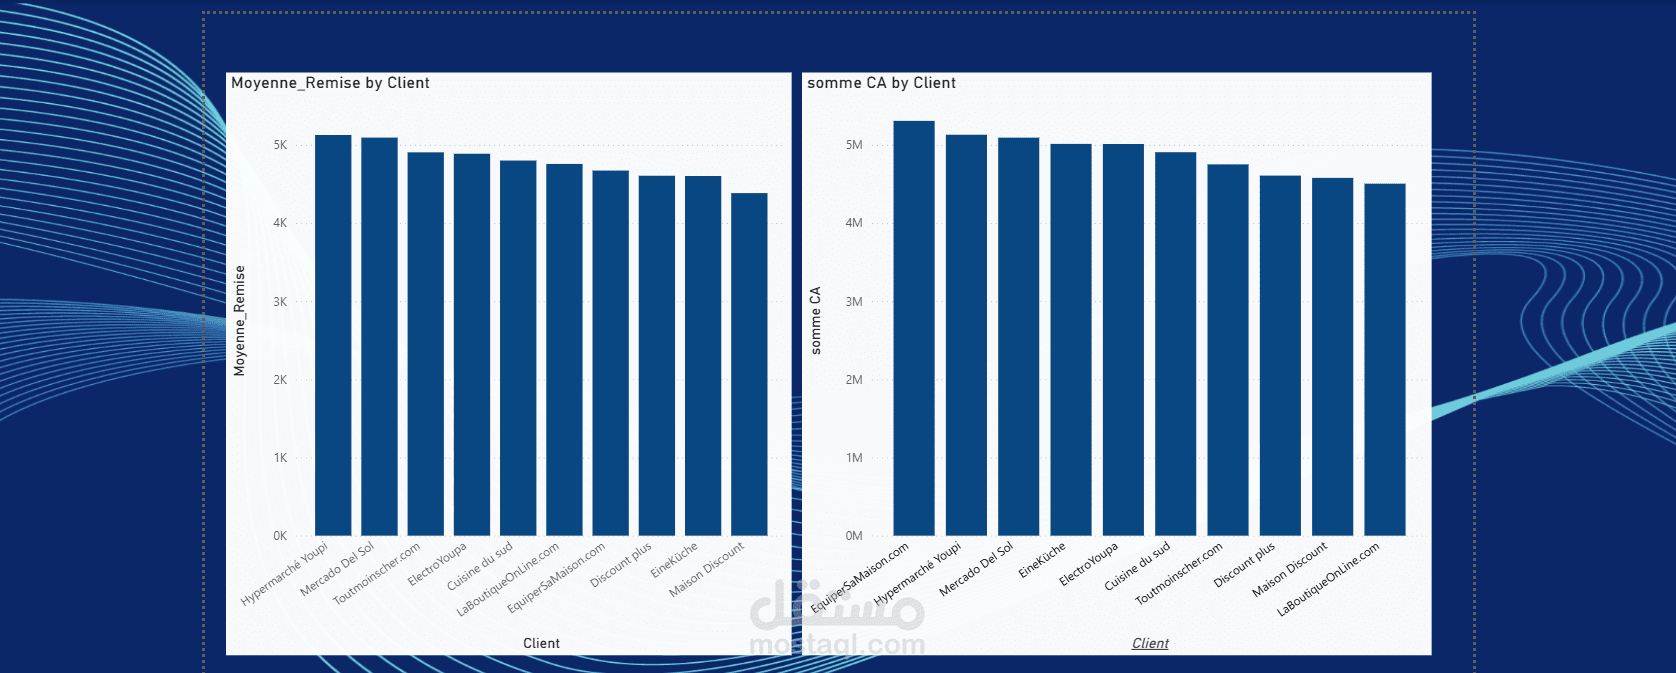
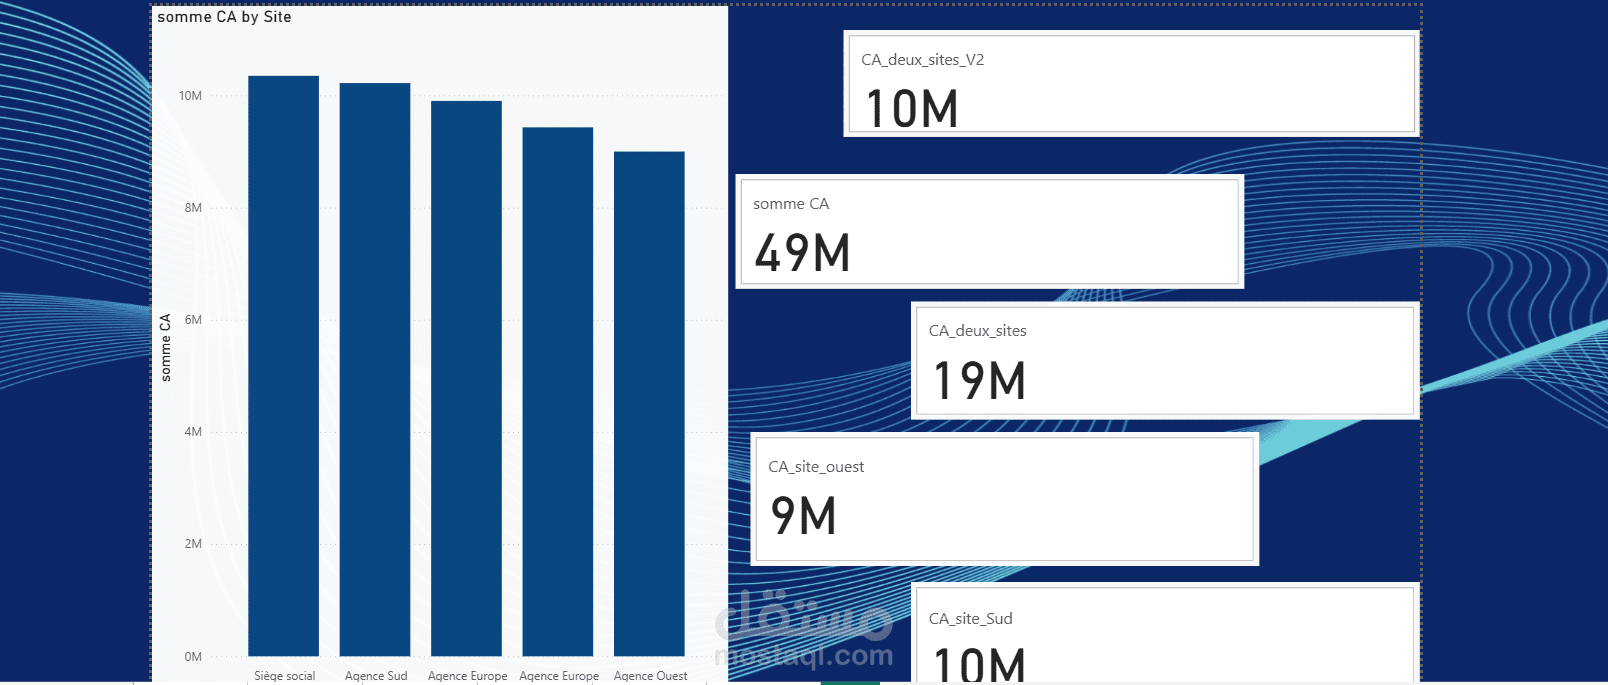
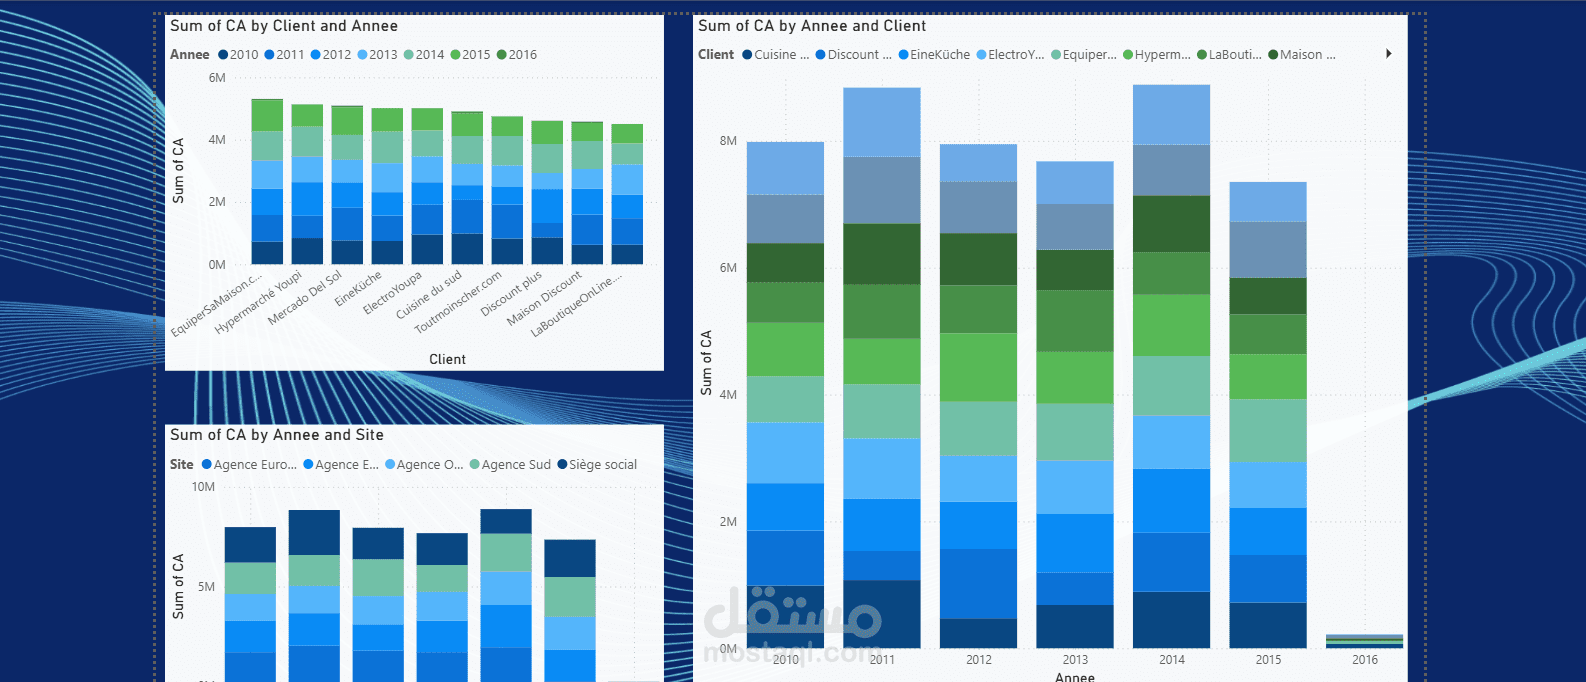
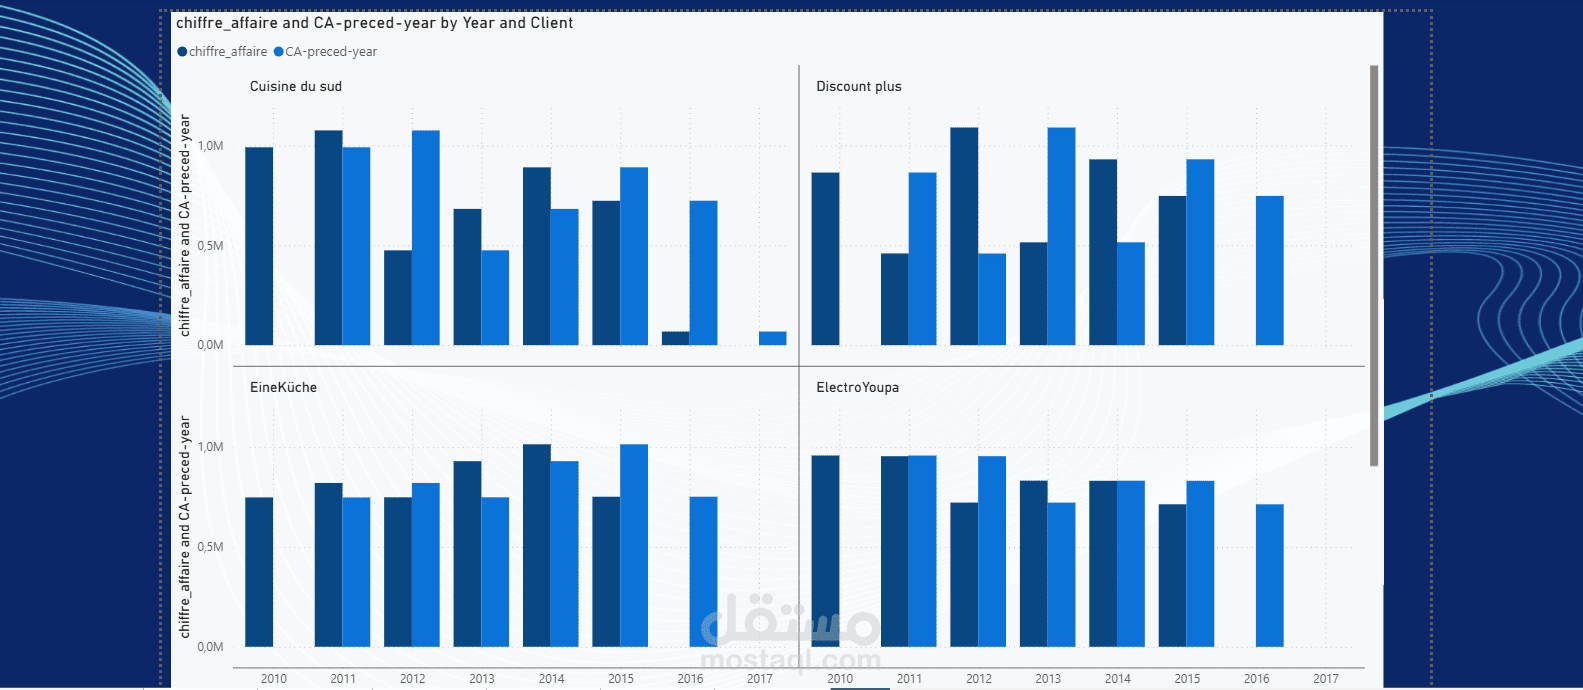
? Sales (CA) analysis by client and site
? Quantity analysis per client
?️ Time-based analysis using quarters (Trimestre)
? Dynamic filters and slicers for better decision-making
? Clear visualizations to identify top clients, trends, and performance gaps
? Why Power BI matters
Power BI is a powerful Business Intelligence tool that enables organizations to:
Centralize and analyze large volumes of data
Visualize KPIs in real time
Support data-driven decisions
Improve performance monitoring and strategic planning
?️ Tools & skills used:
Power BI | Data Modeling | Data Visualization | SQL | Data Analysis | Business Intelligence
This project strengthened my skills in data storytelling, analytical thinking, and BI reporting, and reflects my passion for turning data into meaningful insights.