Social Media Campaign Analysis
تفاصيل العمل
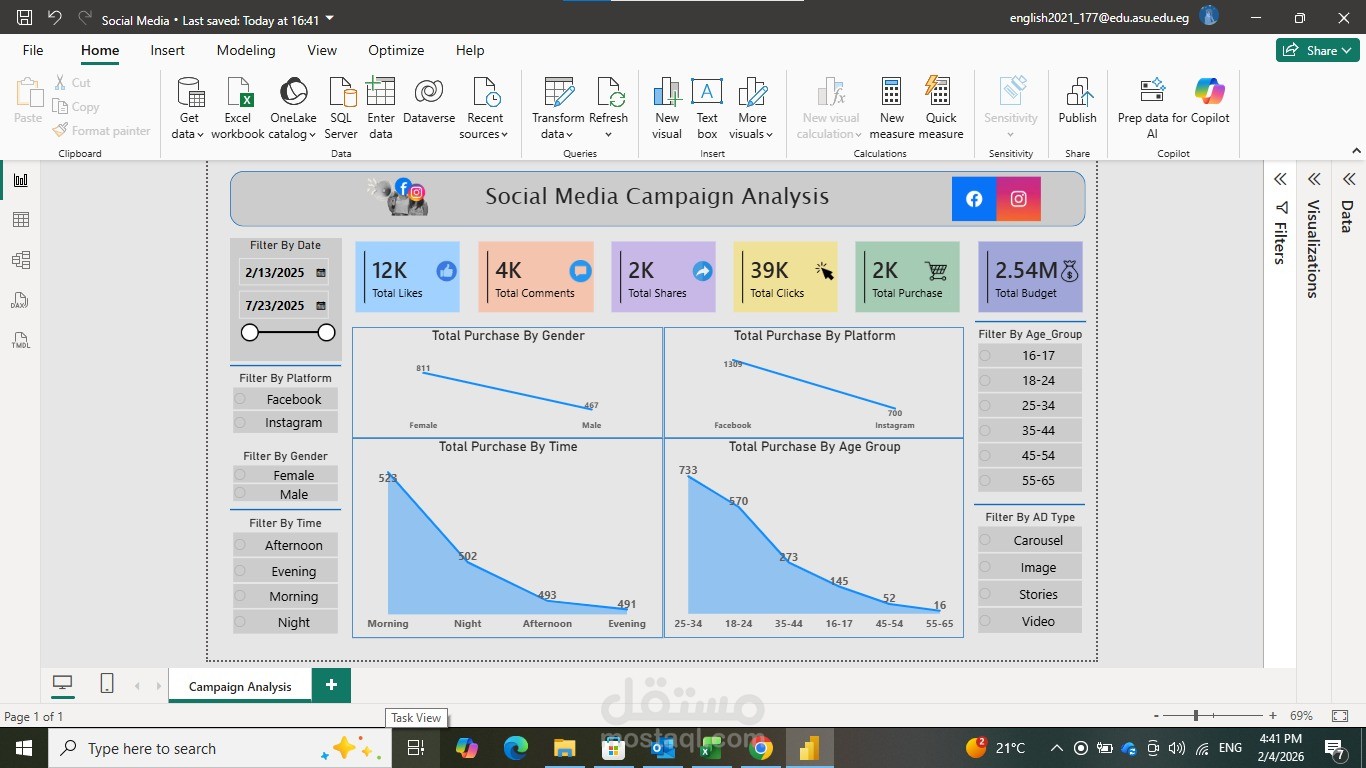
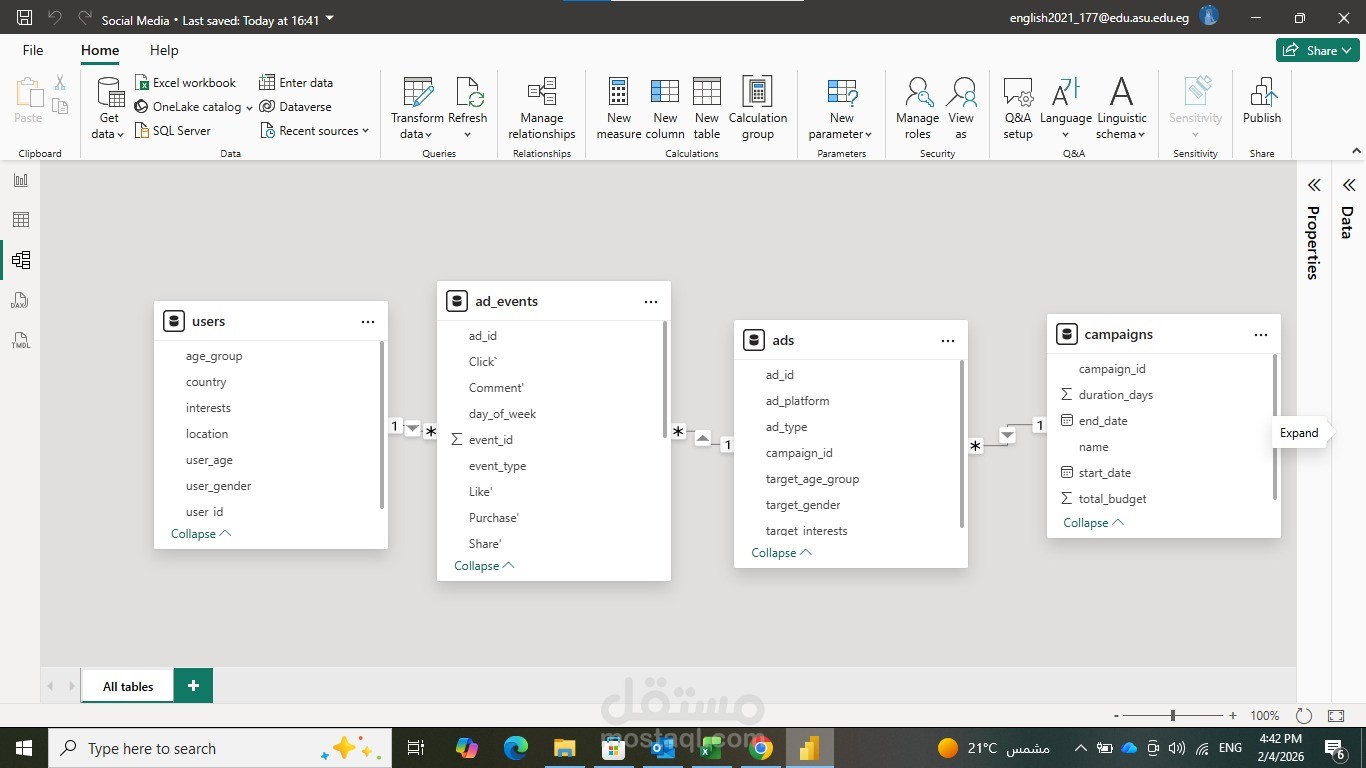

Social Media Campaign Analysis is the process of evaluating the performance of social media campaigns to measure engagement, reach, and effectiveness, and to optimize future marketing strategies.