Instagram Performance Overview
تفاصيل العمل
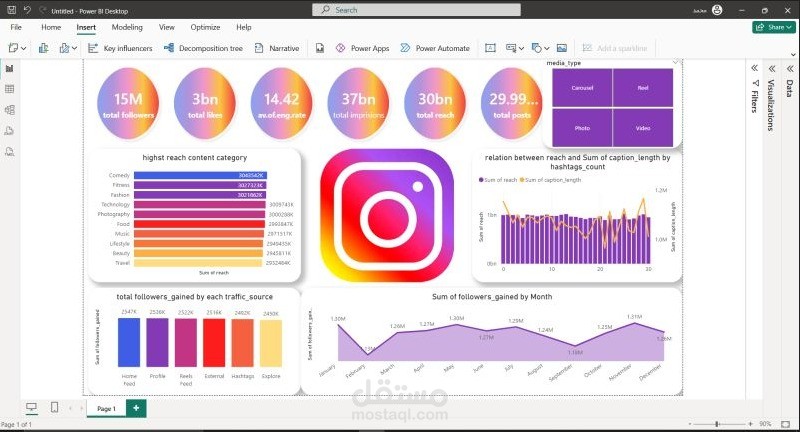
I analyzed Instagram performance data to understand what truly drives reach, engagement, and follower growth — and this dashboard tells a clear story.
---
Key Performance Metrics
Total Followers: 15M
Total Likes: 3B
Average Engagement Rate: 14.42%
Total Impressions: 37B
Total Reach: 30B
Total Posts: 29.99K
? These metrics go beyond big numbers — they reflect strong audience connection and content effectiveness.
---
Top Categories by Reach
1. Comedy – 30.43M
2. Fitness – 30.27M
3. Fashion – 30.21M
4. Technology – 30.09M
5. Photography – 30.00M
? Insight: Entertaining and lifestyle-driven content clearly dominates reach, making it a key growth driver.
---
Content Type Performance
I compared Carousels, Reels, Photos, and Videos to identify what performs best.
? Insight: Reels and visually strong photos consistently generate higher engagement, proving that visual-first content wins.
---
Reach vs Caption Length & Hashtags
Purple bars: Reach
Orange line: Caption Length
? Insight: A balanced caption length combined with relevant, targeted hashtags leads to higher reach and better interaction.
---
Follower Growth by Traffic Source
Home Feed: 2.547K
Profile: 2.536K
Reels Feed: 2.522K
External: 2.516K
Hashtags: 2.492K
Explore: 2.450K
? Insight: Home Feed and Profile visits are the strongest organic sources for follower growth.
---
Monthly Follower Growth Trend
Follower growth shows a stable upward trend, with clear peaks in May (1.30M) and November (1.31M).
? Insight: Seasonal spikes highlight the importance of aligning content strategy and campaigns with audience behavior.
Final Thoughts
This analysis shows how data transforms social media performance from guesswork into strategy.
Which metric do you focus on most when evaluating Instagram performance: Reach, Engagement, or Follower Growth — and why?