Wikipedia Mobile Sales Dashboard
تفاصيل العمل
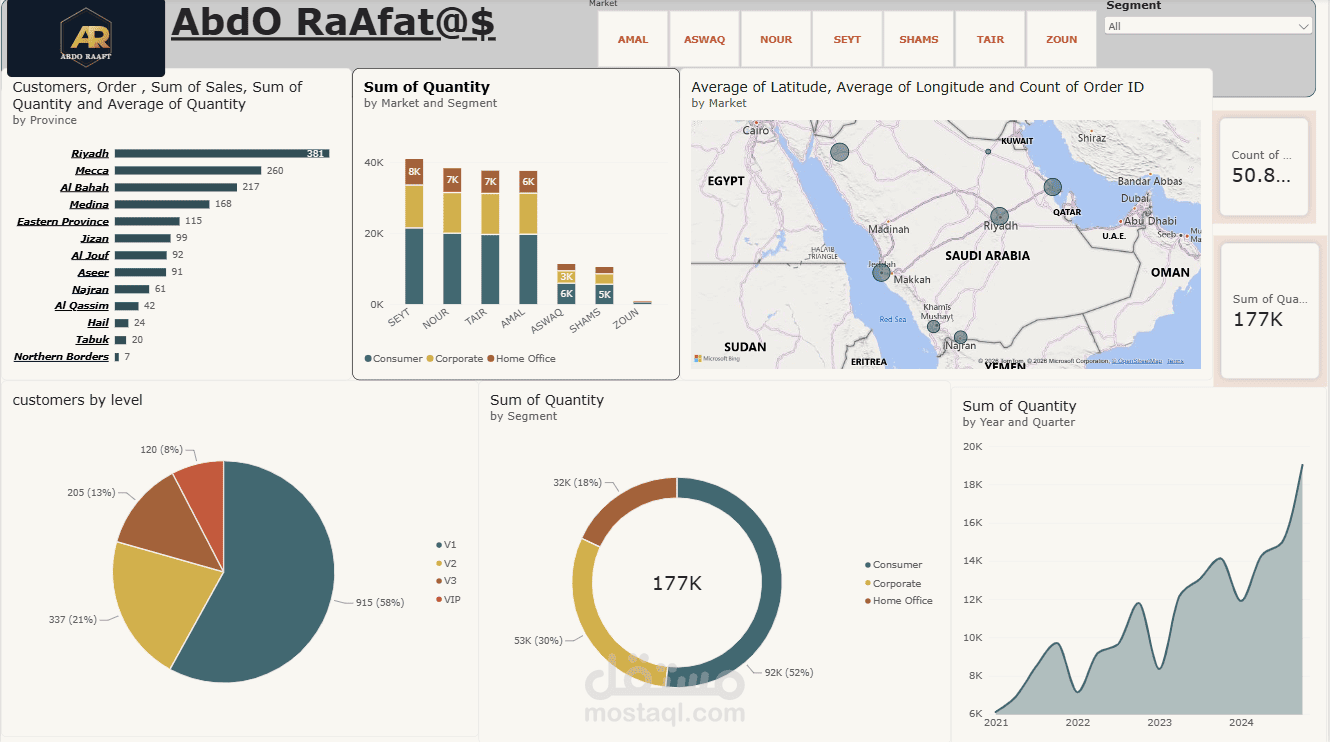
📊 Project Overview
This project presents an interactive Power BI dashboard analyzing historical mobile phone sales data sourced from Wikipedia. The dashboard is designed to provide clear, data-driven insights into sales trends, manufacturer distributions, and market evolutions.
🛠️ Tools & Technologies Used
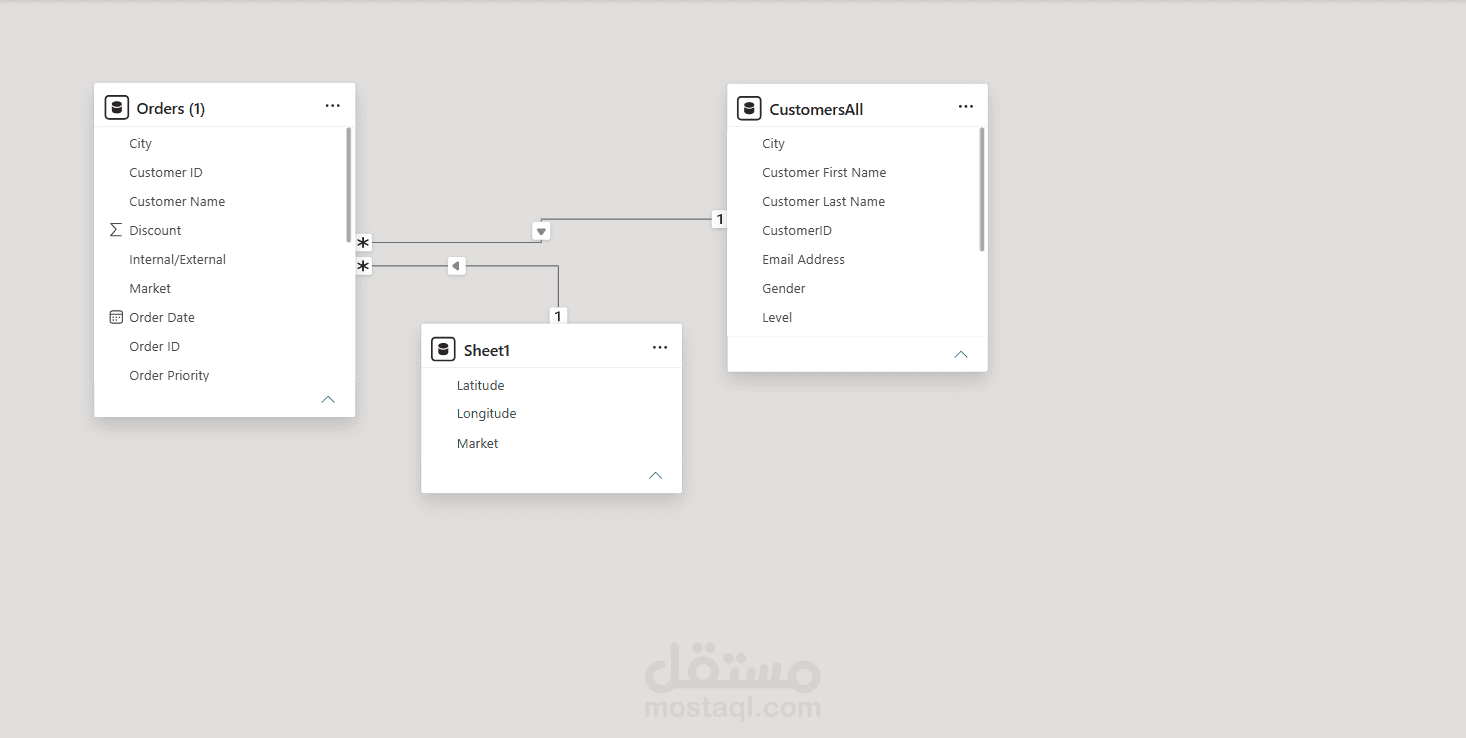
Power BI & DAX: For interactive data visualization, modeling, and custom metrics.
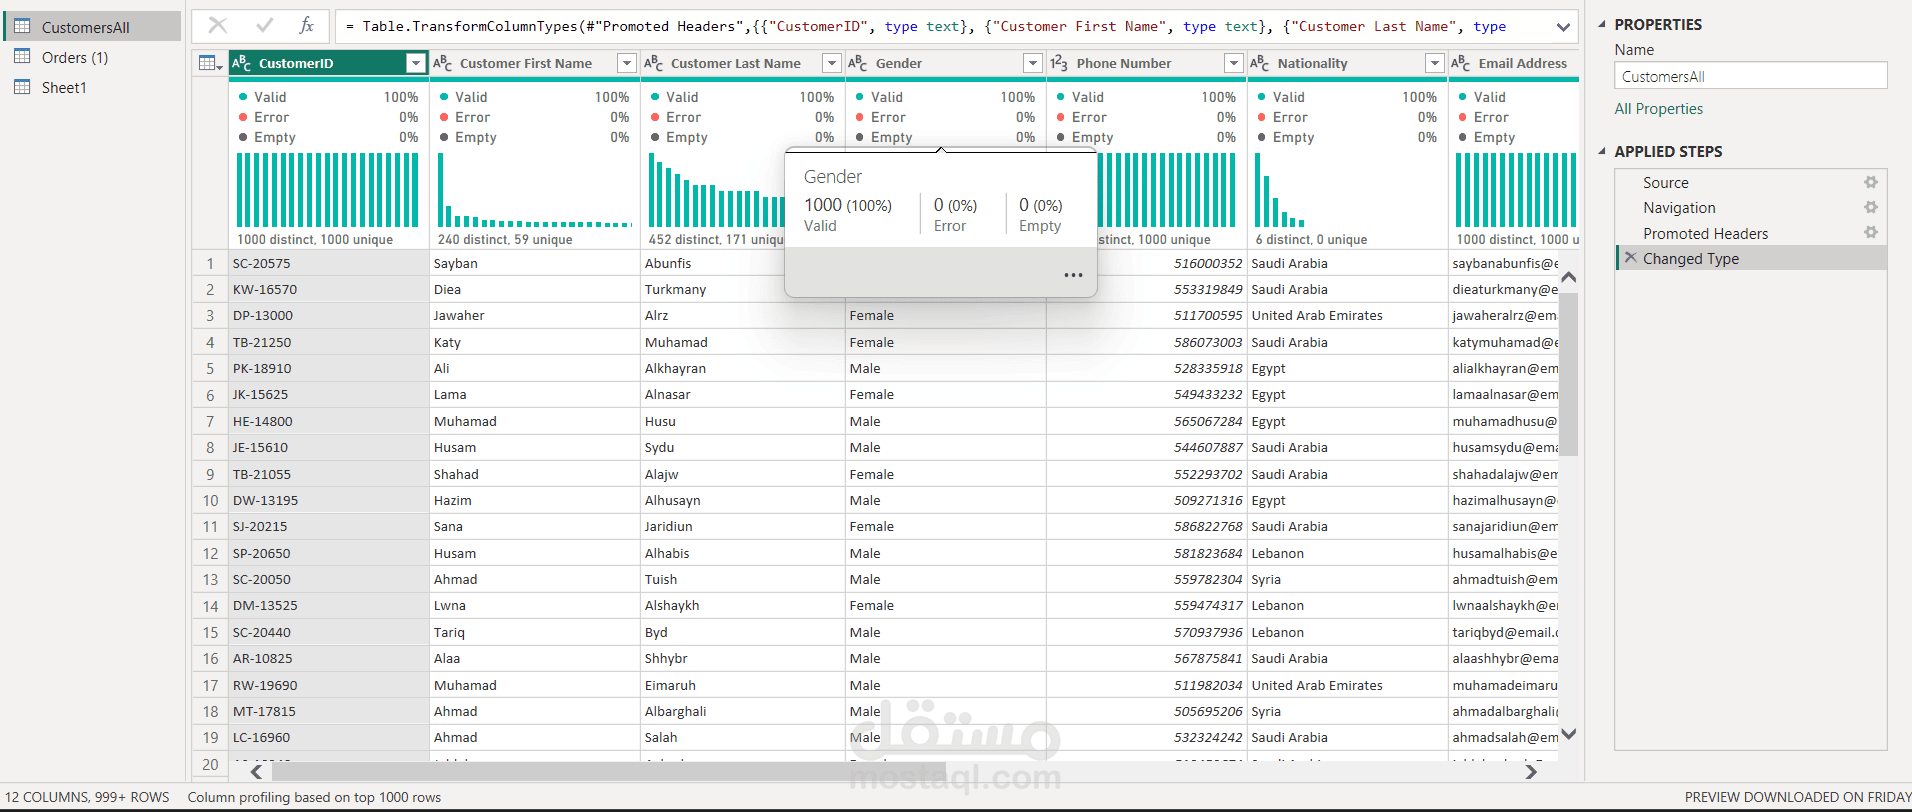
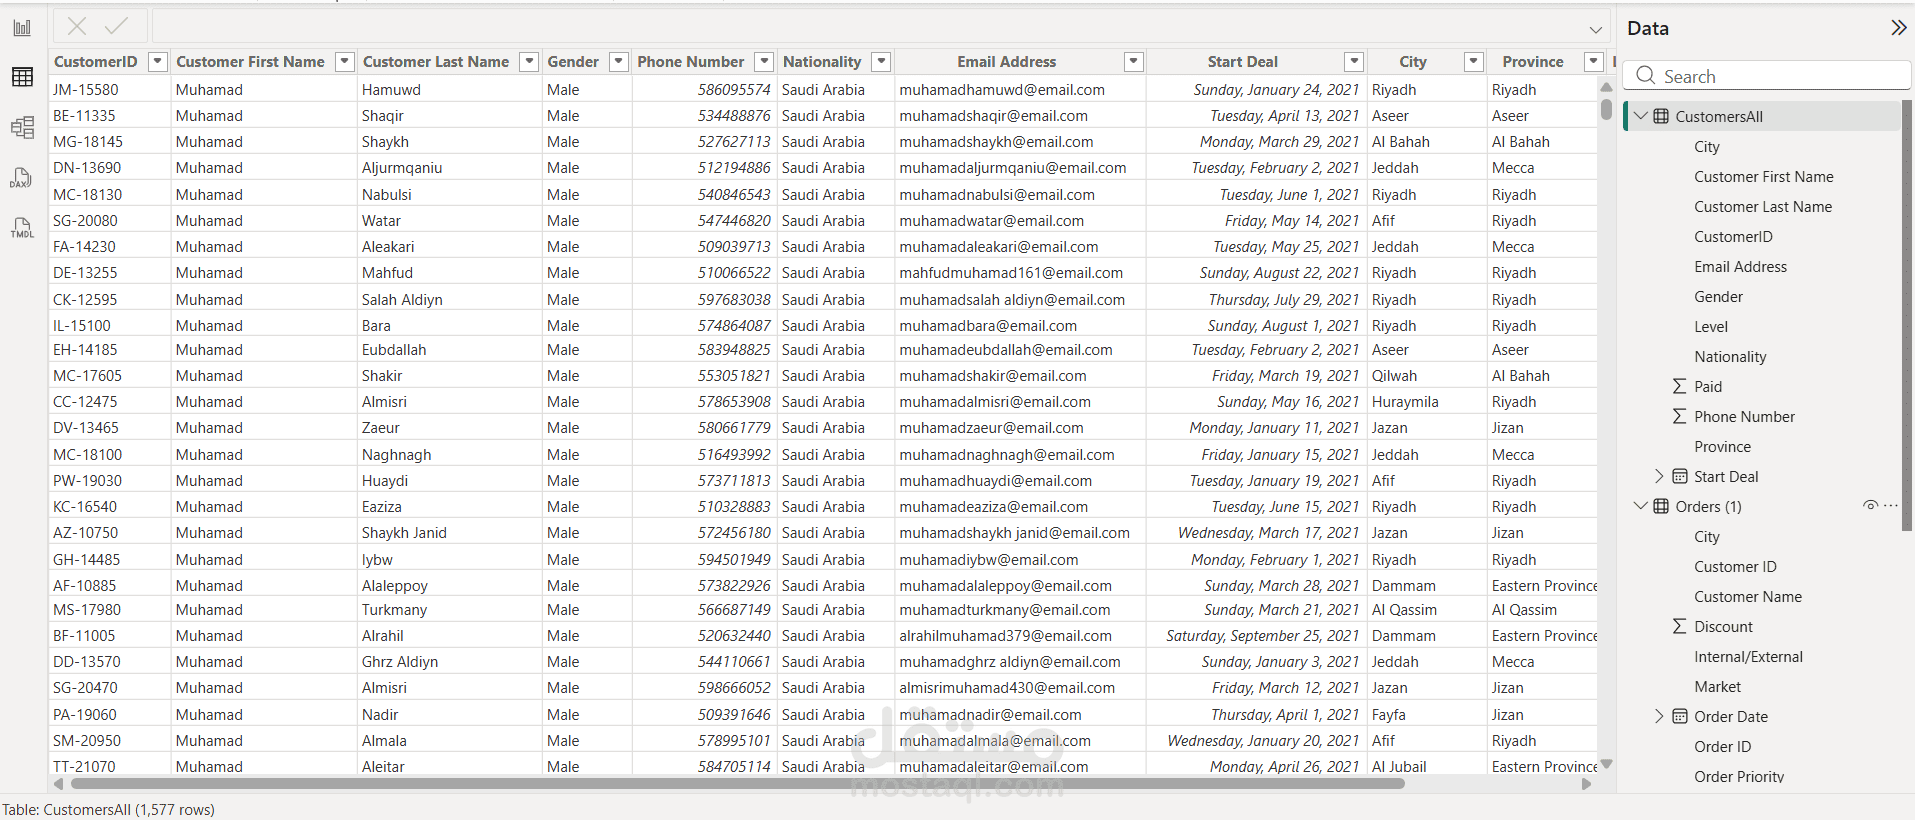
Power Query (ETL): For data transformation, cleaning, and custom column derivations.
Git & GitHub: For project version control and portfolio management.
🚀 Key Features
Decadal Analysis: Breakdown of mobile phone sales evolution across different decades.
Manufacturer Market Share: Comprehensive visual summaries highlighting top-performing brands.
Interactive UI/UX: Clean, modern styling ensuring optimal readability and user experience.
Developed with passion by Abdulrahman Raafat — Data Analyst & Business Intelligence Specialist.