Supermarket sales
تفاصيل العمل
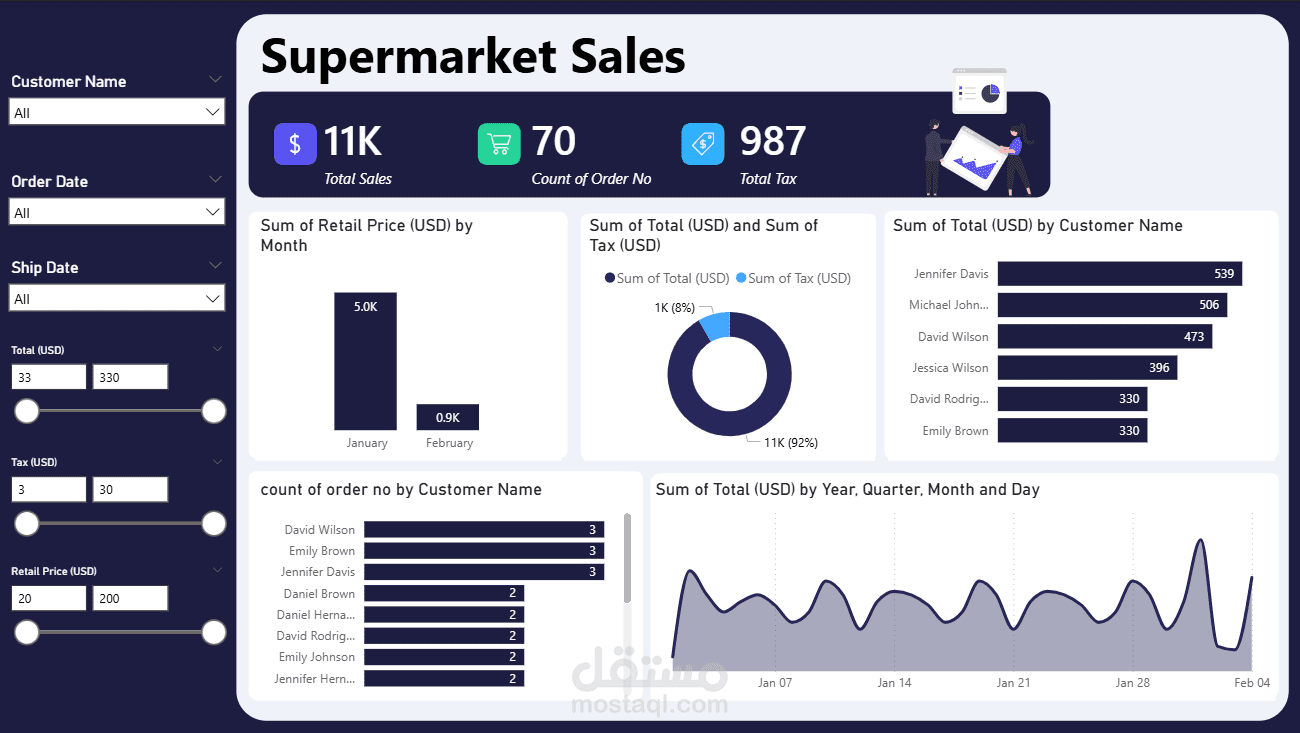
I designed an interactive Supermarket Sales Dashboard using Power BI to analyze sales performance
The dashboard highlights key KPIs such as Total Sales (11K), Order Count (70), and Total Tax
It includes a monthly sales analysis to compare performance across different months
A donut chart visualizes the proportion of tax relative to total sales
It also analyzes total sales and order count by customer to identify top-performing customers
A detailed time-based chart shows sales trends by year, quarter, month, and day
Interactive filters allow users to explore the data dynamically and support data-driven decision-making