World-Population-Dashboard-1970-2022
تفاصيل العمل
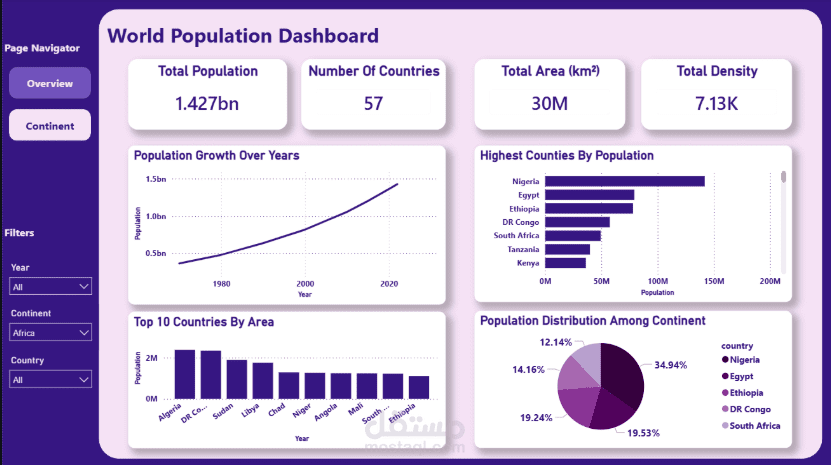

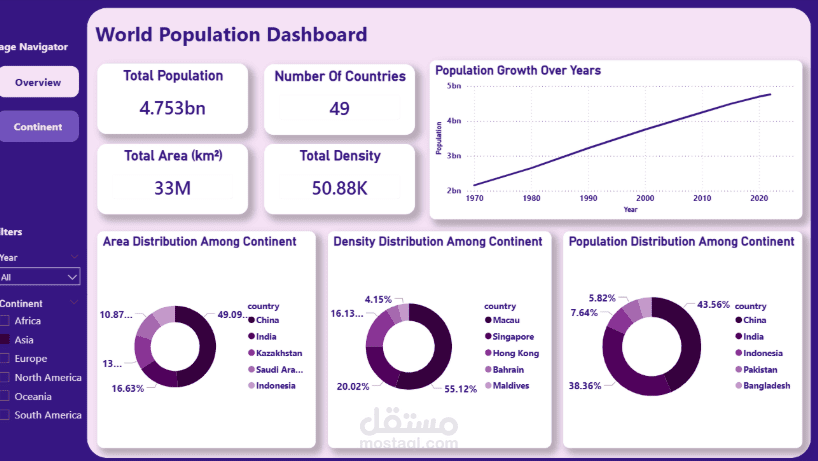
This interactive dashboard visualizes global population trends from 1970 to 2022, with a special focus on continent-level insights. Built using PostgreSQL, DAX, and Power BI, it enables users to explore demographic patterns through dynamic filters and rich visual storytelling.